
This article was meant to start with a simple check: read the most-quoted number in the AI debate at its source. "95 per cent fail" appears on conference slides, in newsletters, under LinkedIn posts, and the source is always named quickly, a report from MIT. Three thorough write-ups we read summarise it carefully. But none of them quotes a single sentence verbatim, and none gives a page number. So we went and got the document ourselves.
That was less dramatic than it sounds. Our scripted request came back HTTP 403, a request carrying a browser header returned the 26 pages. The file had never gone anywhere; only the address MIT originally served it from now redirects to a project overview page. Then we opened the report and looked for the number. It is in there, nobody invented it. It just does not answer the question we came with.
95 per cent of what, exactly?
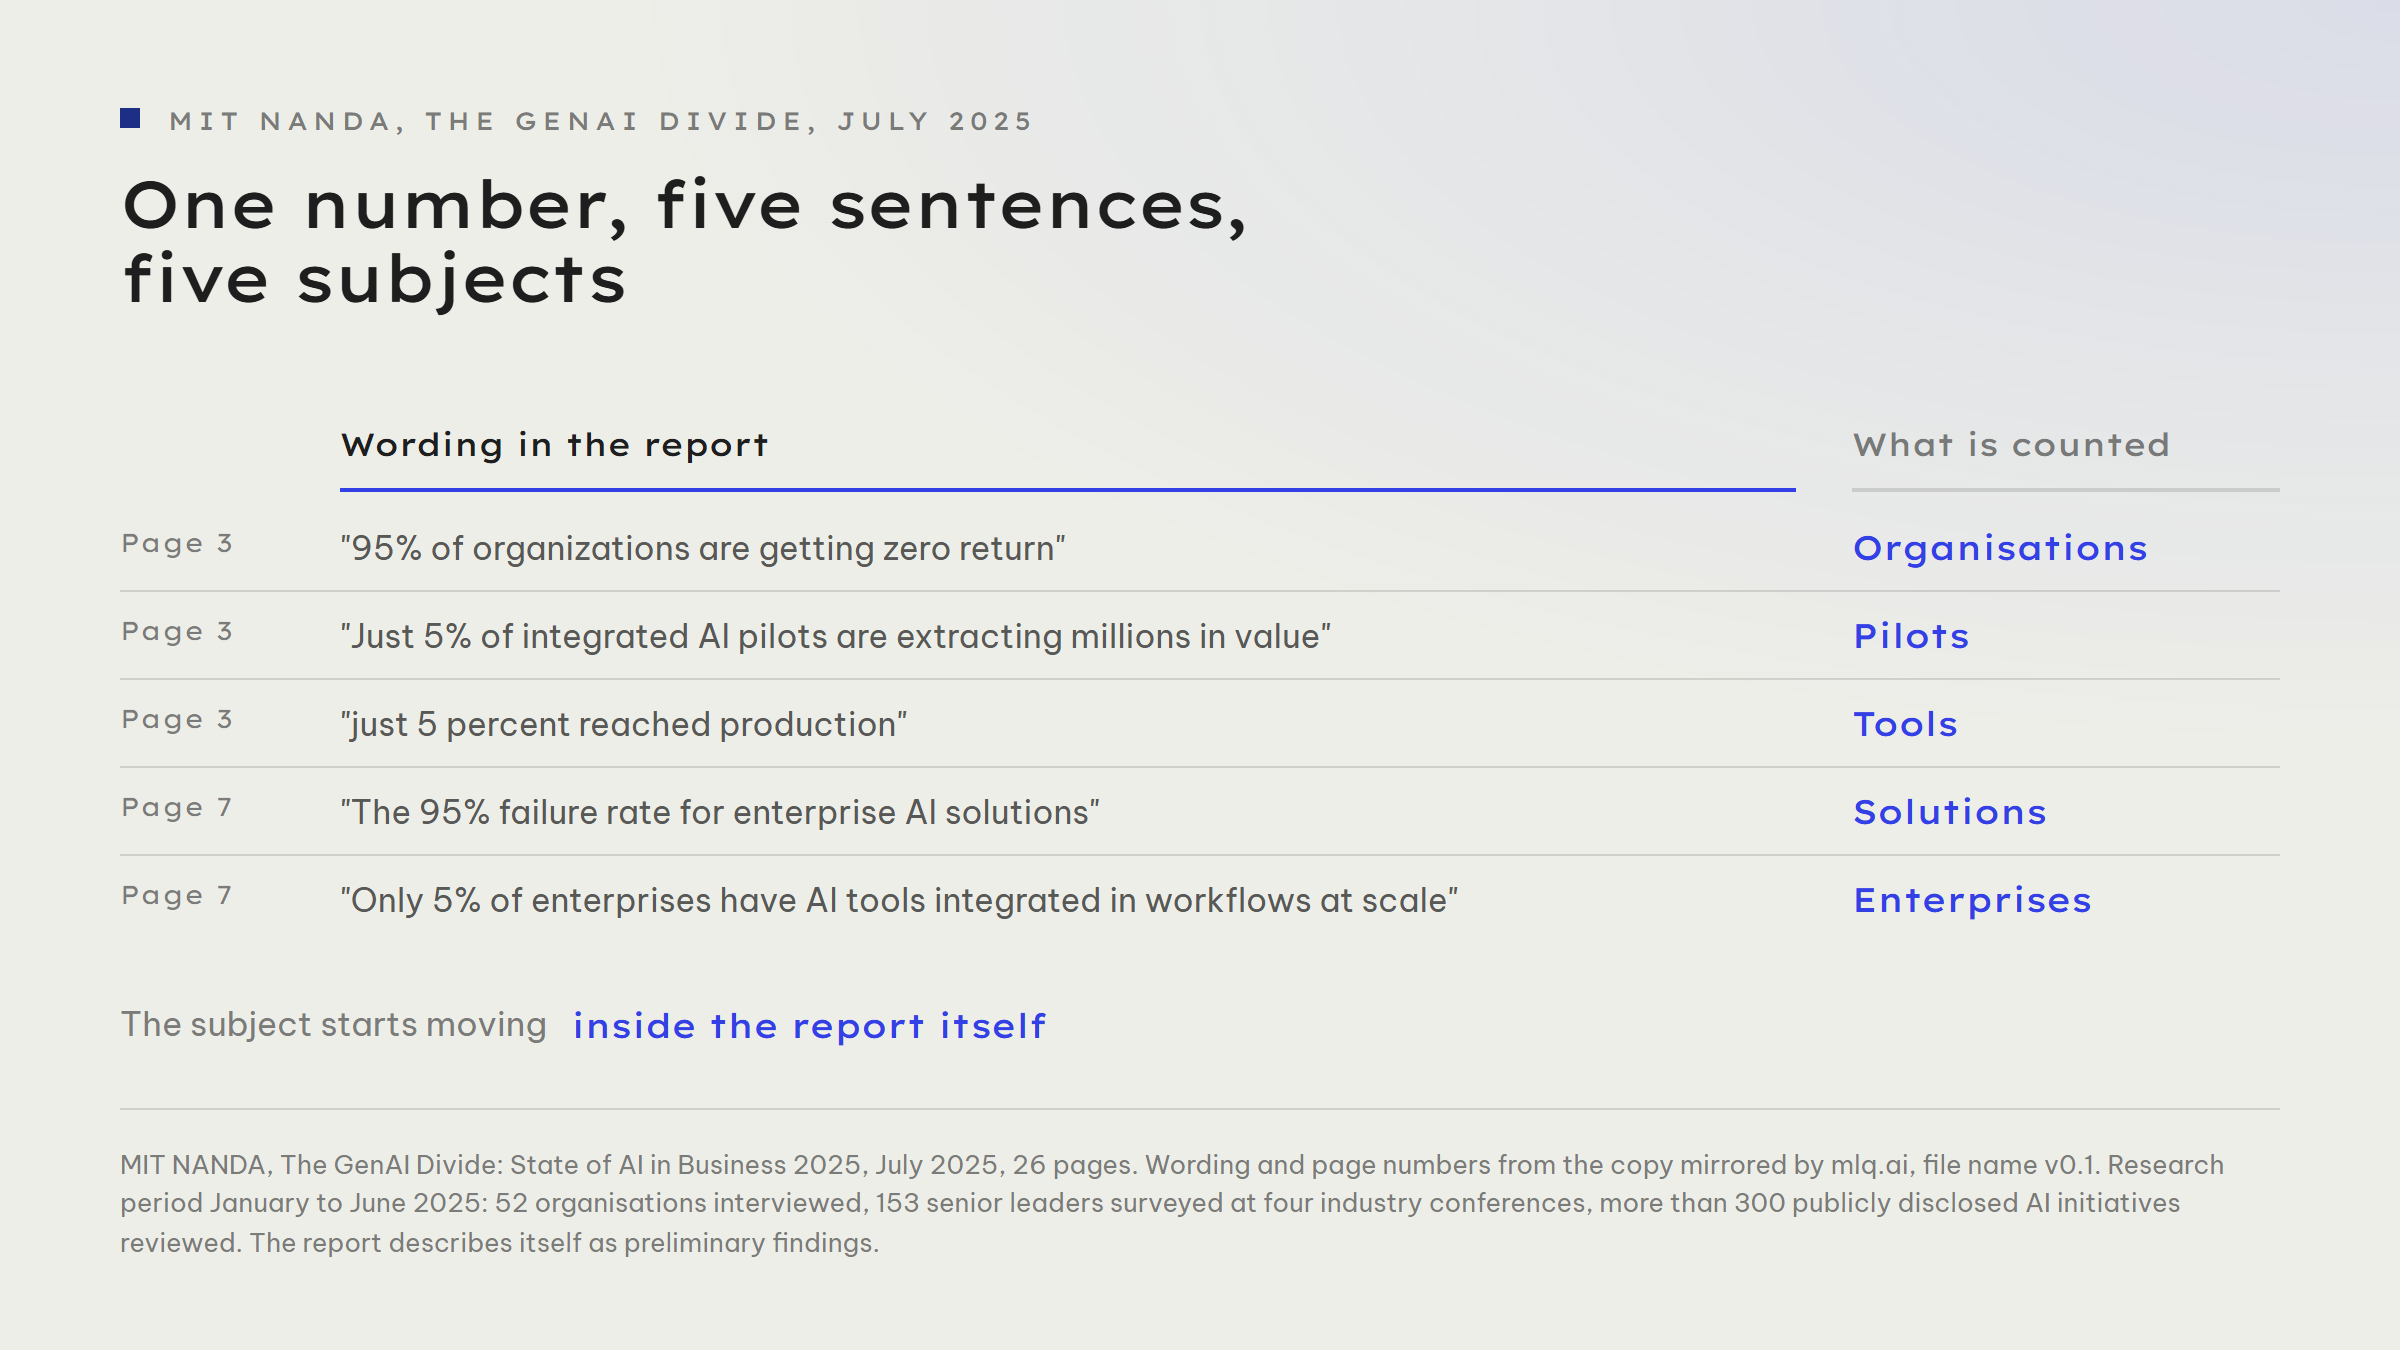
The sentence the citations probably mean sits in the executive summary on page 3: against 30 to 40 billion dollars of enterprise investment, the report finds that "95% of organizations are getting zero return". What is counted is organisations. Two lines further on: "Just 5% of integrated AI pilots are extracting millions in value." What is counted is pilots, and the threshold is not "works" but "millions in value". In the same paragraph, on custom enterprise tools: "just 5 percent reached production", counting tools.
That is the summary done, but not the document. On page 7, beside the well-known funnel chart: "The 95% failure rate for enterprise AI solutions", counting solutions. And a few lines below, in a list of common myths: "Only 5% of enterprises have AI tools integrated in workflows at scale", counting enterprises.
Five passages in one document, and each one counts something different.
That is the real finding, and it is more awkward than a misquote: the report uses the same percentage for five different subjects. Take it from there and you can attach it to organisations, pilots, tools, solutions or enterprises, with a citable passage for every version. Used five times over, the subject is easy to lose without anyone copying anything down wrongly.
We treat the page 3 sentence as the authoritative one because it sits in the summary. But that is our reading, not the report's ruling.
Did we really read the document?
The question belongs here, because we ask it of everybody else's sources. The report is called "The GenAI Divide: State of AI in Business 2025" and comes out of MIT's Project NANDA, spelled out in the appendix as Networked Agents And Decentralized Architecture. The authors are Aditya Challapally, Chris Pease, Ramesh Raskar and Pradyumna Chari, dated July 2025. The version we could read is a copy mirrored by mlq.ai under the file name v0.1; its metadata names Challapally as author and 13 July 2025 as the creation date, so it is plausibly genuine.
Even so: we read a copy, not a file served by MIT.
On page 2 the paper describes itself, and that paragraph does not appear in any of the write-ups we read. The heading there is "Preliminary Findings". Research period January to June 2025. The method, verbatim: "a systematic review of over 300 publicly disclosed AI initiatives, structured interviews with representatives from 52 organizations, and survey responses from 153 senior leaders collected across four major industry conferences". In plain terms: 52 organisations interviewed, 153 senior leaders surveyed at conferences, more than 300 publicly announced AI initiatives reviewed from a desk.
A sound qualitative study, but not a representative sample, and nowhere does the paper claim otherwise. It is a 26-page Word export of preliminary findings, not a peer-reviewed paper. The 30 to 40 billion dollars of investment that travel with almost every citation carry no source of their own in the document.
Where we quoted the number wrong ourselves
Before we talk about anyone else's headlines, a look at our own archive. We searched our articles for the number. There are three, and they say three different things. Make or buy for AI projects said "95 per cent of GenAI pilots" until recently; it now reads "95 per cent of organisations get no measurable return from GenAI". AI agent or workflow said "95 per cent of the GenAI pilots it examined". And in What an AI strategy really costs, a subheading asked why 95 per cent of AI projects fail.
Organisations, pilots, projects: one number, three subjects, one publisher, and nobody noticed for months.
Both passages now name the subject the report uses on page 3. The second finding is more uncomfortable, because it concerns the methodology. In the costs article we cited a Fortune write-up and adopted its method line: 150 executives interviewed, 350 employees surveyed, 300 public AI deployments analysed. The version we have now read gives 52 organisations, 153 senior leaders and more than 300 publicly disclosed initiatives. The same diverging figures appear in the write-up by the National CIO Review.
We cannot resolve that contradiction from the document we hold, so we are not claiming the other figures are wrong. We are only saying we passed on a method line without ever holding it against a document. The costs article now carries both method lines side by side, ours and the report's, along with the note that we cannot resolve the contradiction.
By that point the source check had turned into a content audit of our own archive, which is the right order anyway: if you write about evidence, you start with your own.
How does a number start wandering?
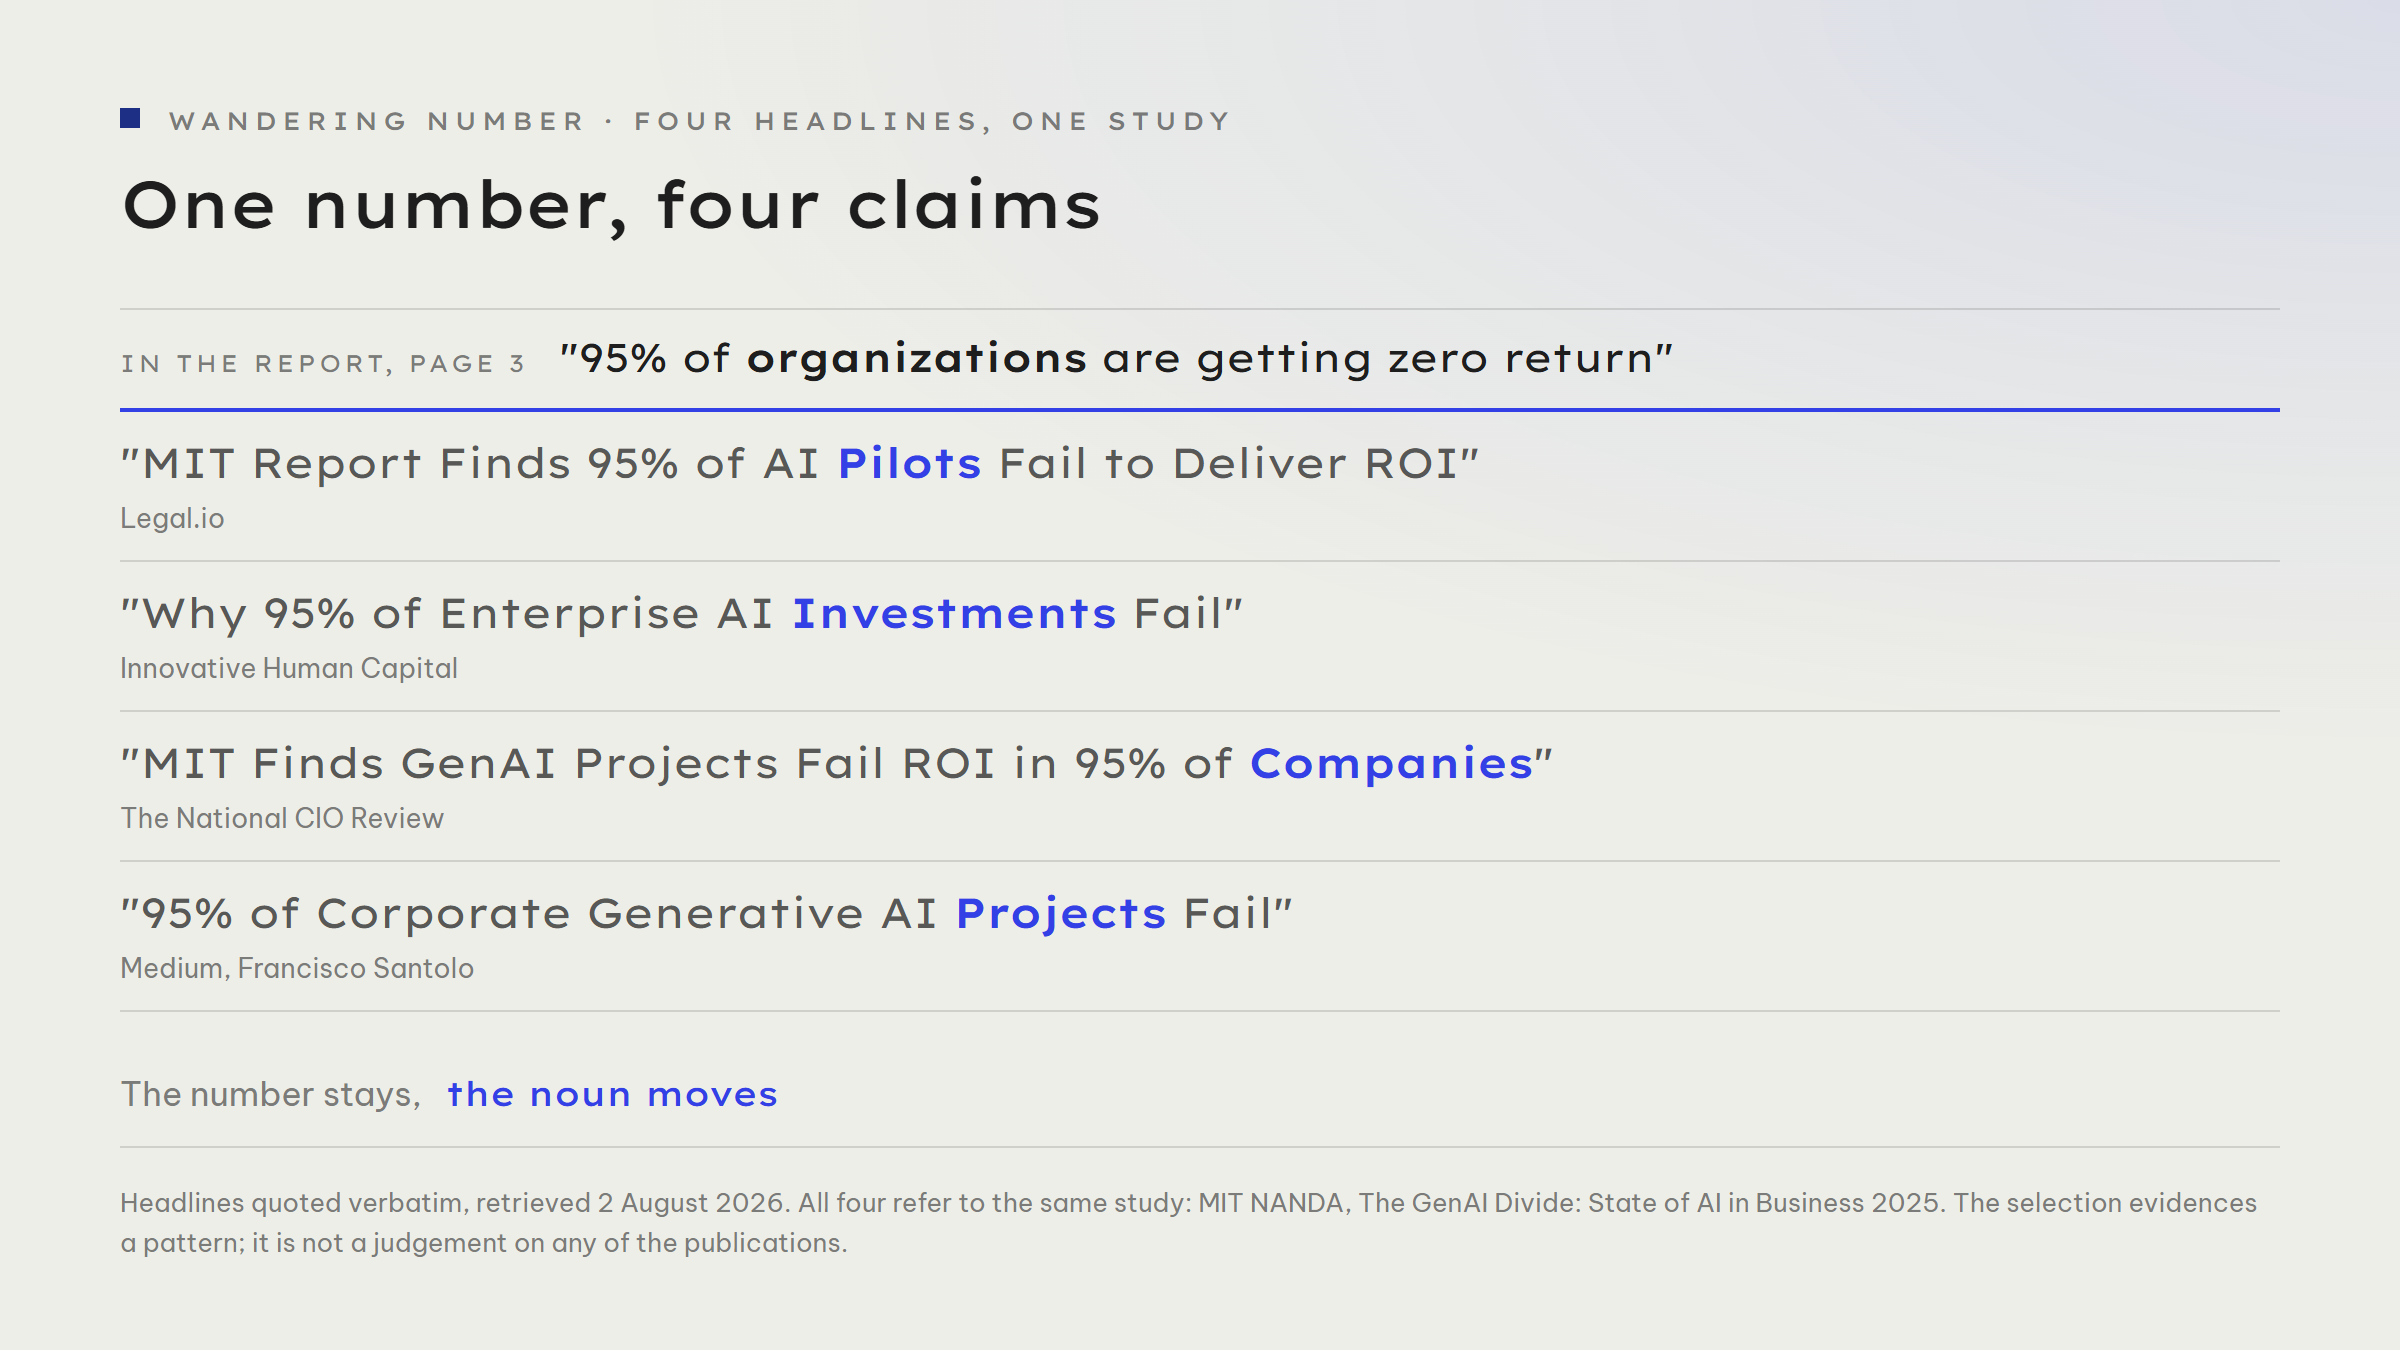
We call this a wandering number: the digits stay put, the noun beside them changes, and because the digits absorb the attention, the swap barely registers. Four real headlines about the same study show the movement: at Legal.io pilots fail, at Innovative Human Capital investments fail, at the National CIO Review it is projects failing inside companies, at Medium projects fail. Four nouns, and none of the publications made anything up: for every version there is a passage in the report that roughly supports it.
That is what makes a wandering number so durable: it is never quite wrong.
The second half of the movement is easier still to miss, because it happens to the verb. The report says "getting zero return". The headlines say "fail". Those are not the same thing. A company running four pilots, two of which work perfectly well but never surface in group results, sees no measurable return. Nothing there has failed.
Once an absence of evidence becomes a failure, the claim has flipped: a measurement problem has turned into a technology problem. Same mechanism as a hallucination in AI-written text, only slower: each version sounds crisper than the last, and every step widens the gap to the original.
Why is this not pedantry?
Because a different decision hangs on each subject. If the figure stands for organisations that see no measurable return, that is a measurement and portfolio problem: nothing connects spend to outcome. The consequence is metrics before kick-off, not more technology. If it stands for custom tools that never reach production, that is a procurement and integration problem, and the consequence is different selection criteria and less in-house building. And if that share of pilots really did fail, that would be a craft problem in project management.
Three diagnoses, three budgets, the same number on the slide.
Then there is the threshold, almost never quoted along with it. The 5 per cent on the success side are the ones extracting "millions in value". A pilot saving 200,000 euros a year lands among the 95 per cent, even though a mid-sized company would call it a win. Use the number as a warning against AI projects and you are applying an enterprise threshold to a mid-market decision.
In fairness: the report handles its own numbers more carefully than most of the people quoting it. Page 6 notes beside the funnel chart that the figures are "directionally accurate based on individual interviews rather than official company reporting", that sample sizes vary by category and that success definitions differ between organisations. Page 7 defines successfully implemented as tools where users or executives remarked on a "marked and sustained" effect. Success here is a perception drawn from interviews, not an accounting entry.
And in the appendix the authors concede that their six-month observation window may be too short for complex systems, potentially understating the success rate. We found none of these three caveats in any headline. They sit in the paper, right next to the number.
How do you check a number in five minutes?
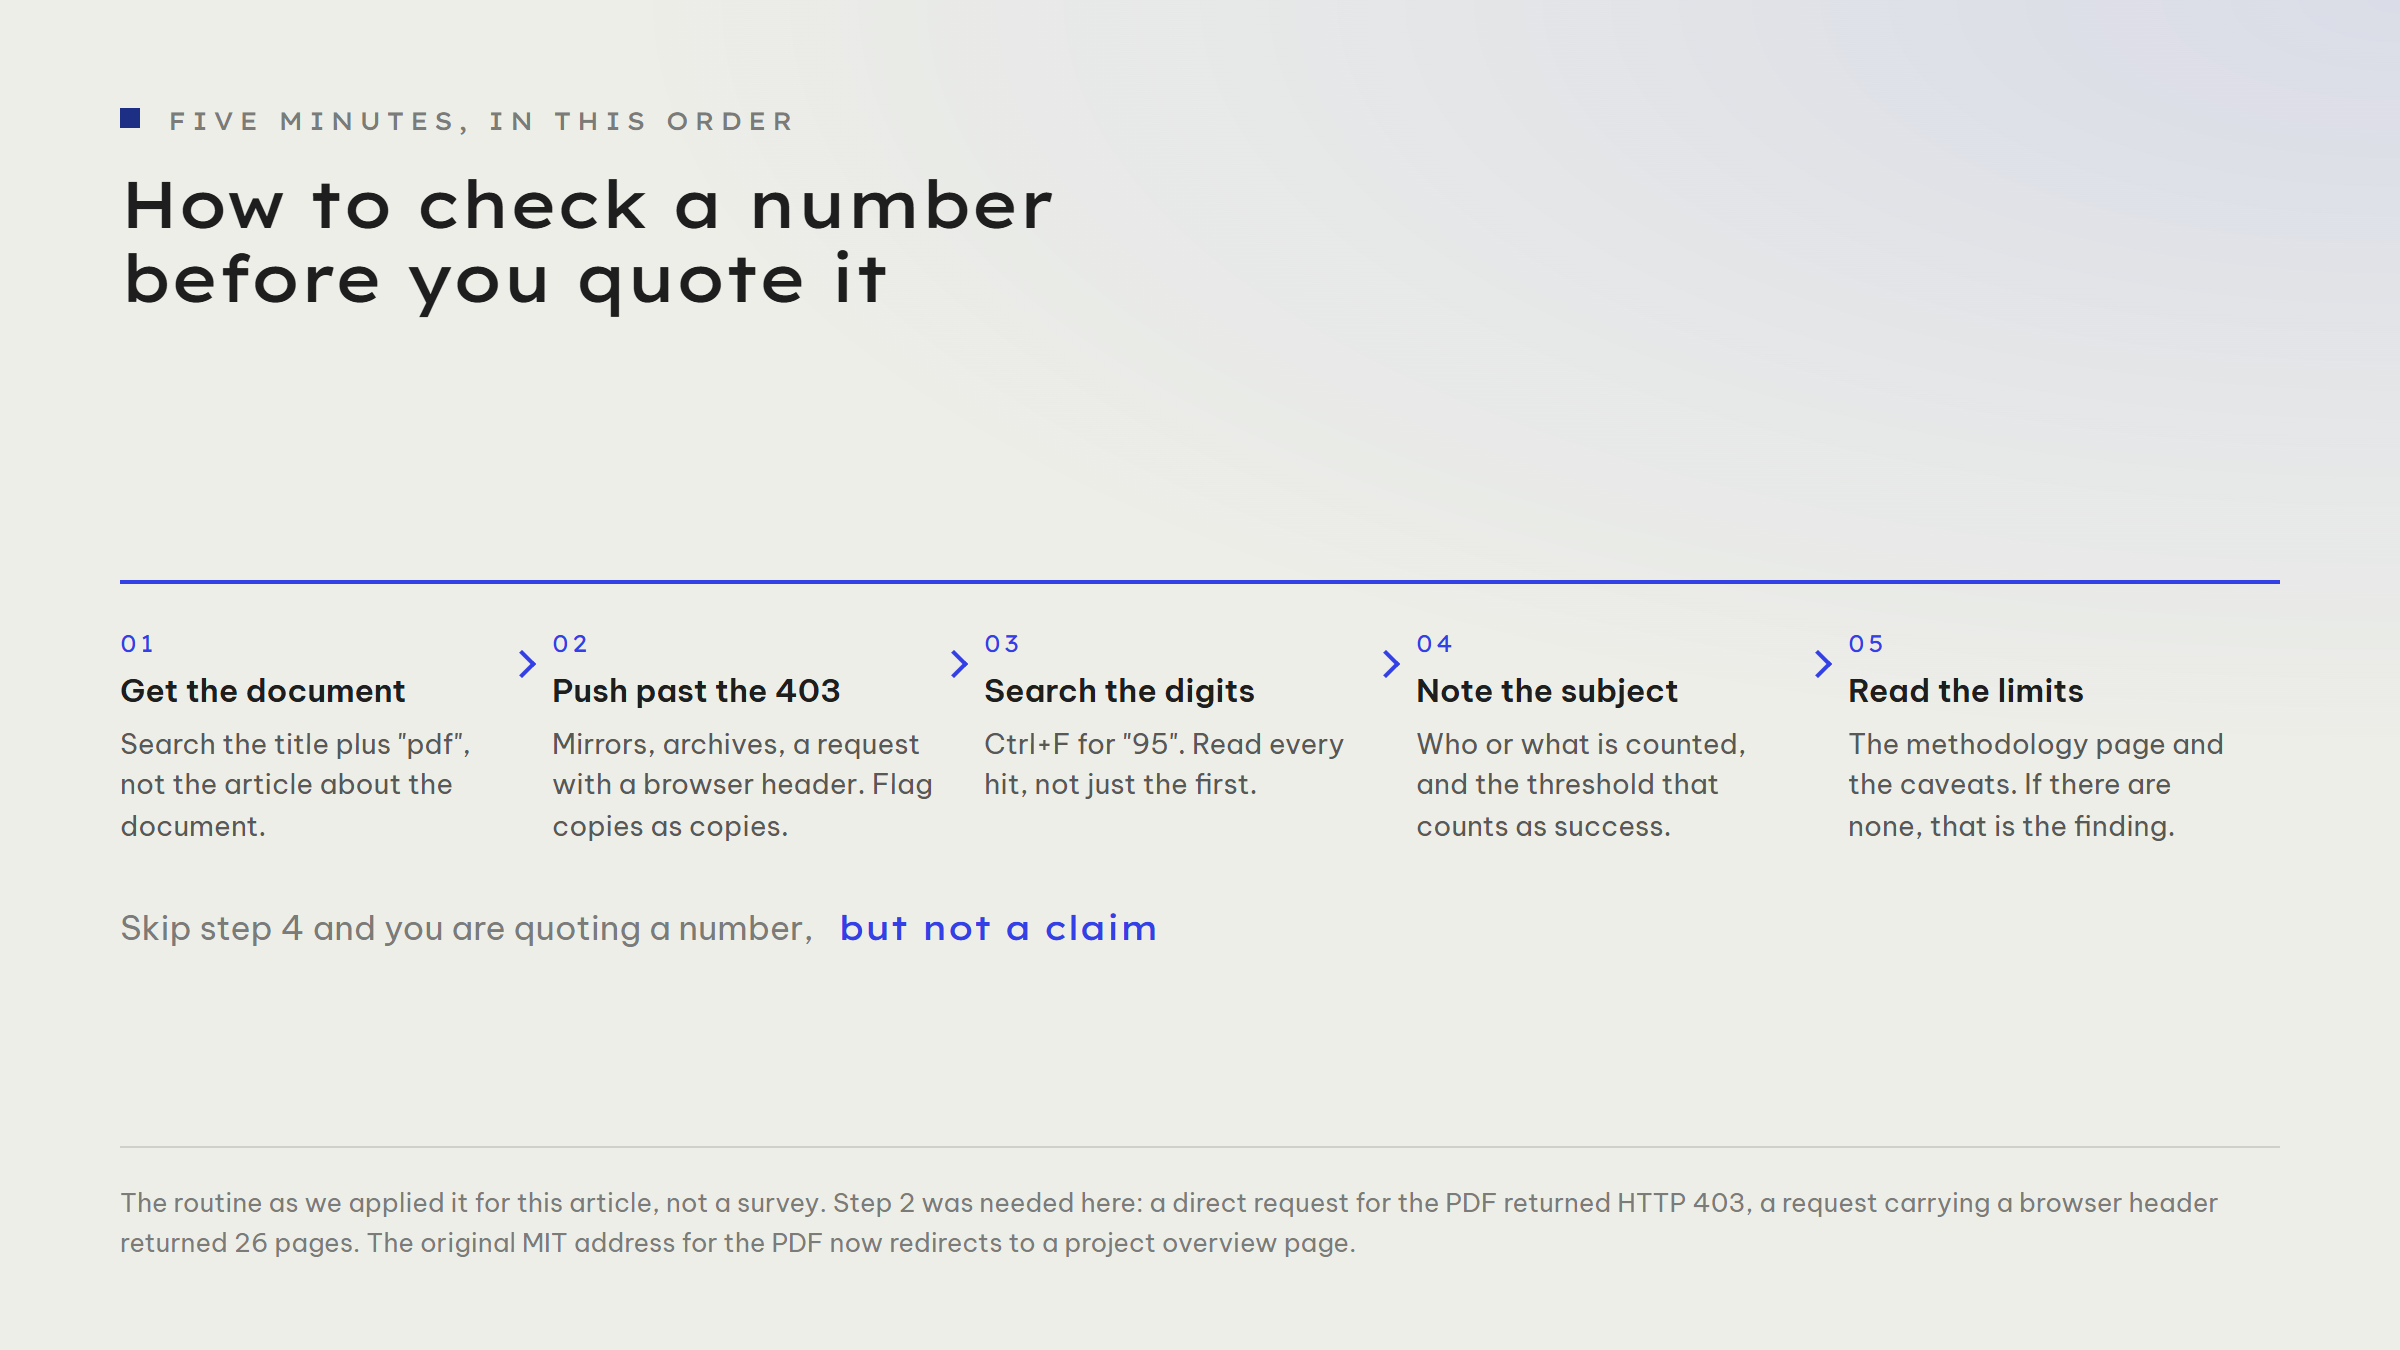
Step one: find the document, not the article about the document. The title plus "pdf" usually does it. If after ten minutes all you find is articles citing each other, the number probably has no floor, and that alone is a result.
Step two: a blocked file is not a reason to stop. Mirrors, archive services and a request that identifies as a browser often get you there. If you end up reading a copy, say so, and check the file metadata to see whether author and creation date match the claimed origin.
Step three: search for the digits, not the claim. Ctrl+F for "95", then read every hit, not just the first. In our case there were five. Step four, the important one: write down the subject and the threshold. Who or what is counted, and what counts as success. Without that sentence you have a number but no claim.
Step five: read the methodology page and the limitations. If there are none, that is the finding about the paper.
And how do you spot a secondary source that is only paraphrasing? Four signs. It gives no page number. It puts no quotation marks around the decisive sentence. Its sentence reads smoother than any research paper ever sounds. And the method figures are conspicuously round, 150 and 350 instead of 52 and 153. Round figures are often the tell of a number that has already passed through several hands.
Three levers for your next presentation
Lever 1: take the number that appears most often in your deck and find its source document. Just that one. Ten minutes, using the five steps above. Either you find it and know more afterwards, or you do not, and then the slide is the problem, not the research.
Lever 2: put the subject on the slide, not just the number. So "95 per cent of organisations with no measurable return, MIT NANDA, July 2025, 52 organisations" instead of "95 per cent fail". It costs one line, it reads as confident rather than fussy, and it protects you from the one question in the room that would otherwise topple your argument.
Lever 3: add a number line to your editorial process. One sentence per figure covering document, page, subject, field period and threshold, filed next to the text rather than held in someone's head. Anyone quoting numbers builds part of their credibility on someone else's ground; the number line turns that into verifiable experience and trustworthiness instead of assertion.
Writing this article turned up three misquotes of our own, two of them still open. If you would like your own material checked from the outside, research figures, case examples or pricing claims: we do this regularly, and we report the uncomfortable findings too. Book an appointment and we will go through the evidence you rely on most. 🔍