
The moment of signature is the moment of peak attention. Your new client has just decided to invest money and trust in you, and is waiting for something to happen. This is exactly where the thread snaps for many service businesses: sales celebrates, delivery is not ready yet, and the client hears nothing for three days. Onboarding automation does not mean handing this phase over to software. It means automating the mechanical steps so there is time left for the personal ones. Let us look at why the first 14 days weigh so heavily, what belongs in them, which steps automation handles well and how you measure whether your onboarding holds up.
Why do the first 14 days decide the whole relationship?
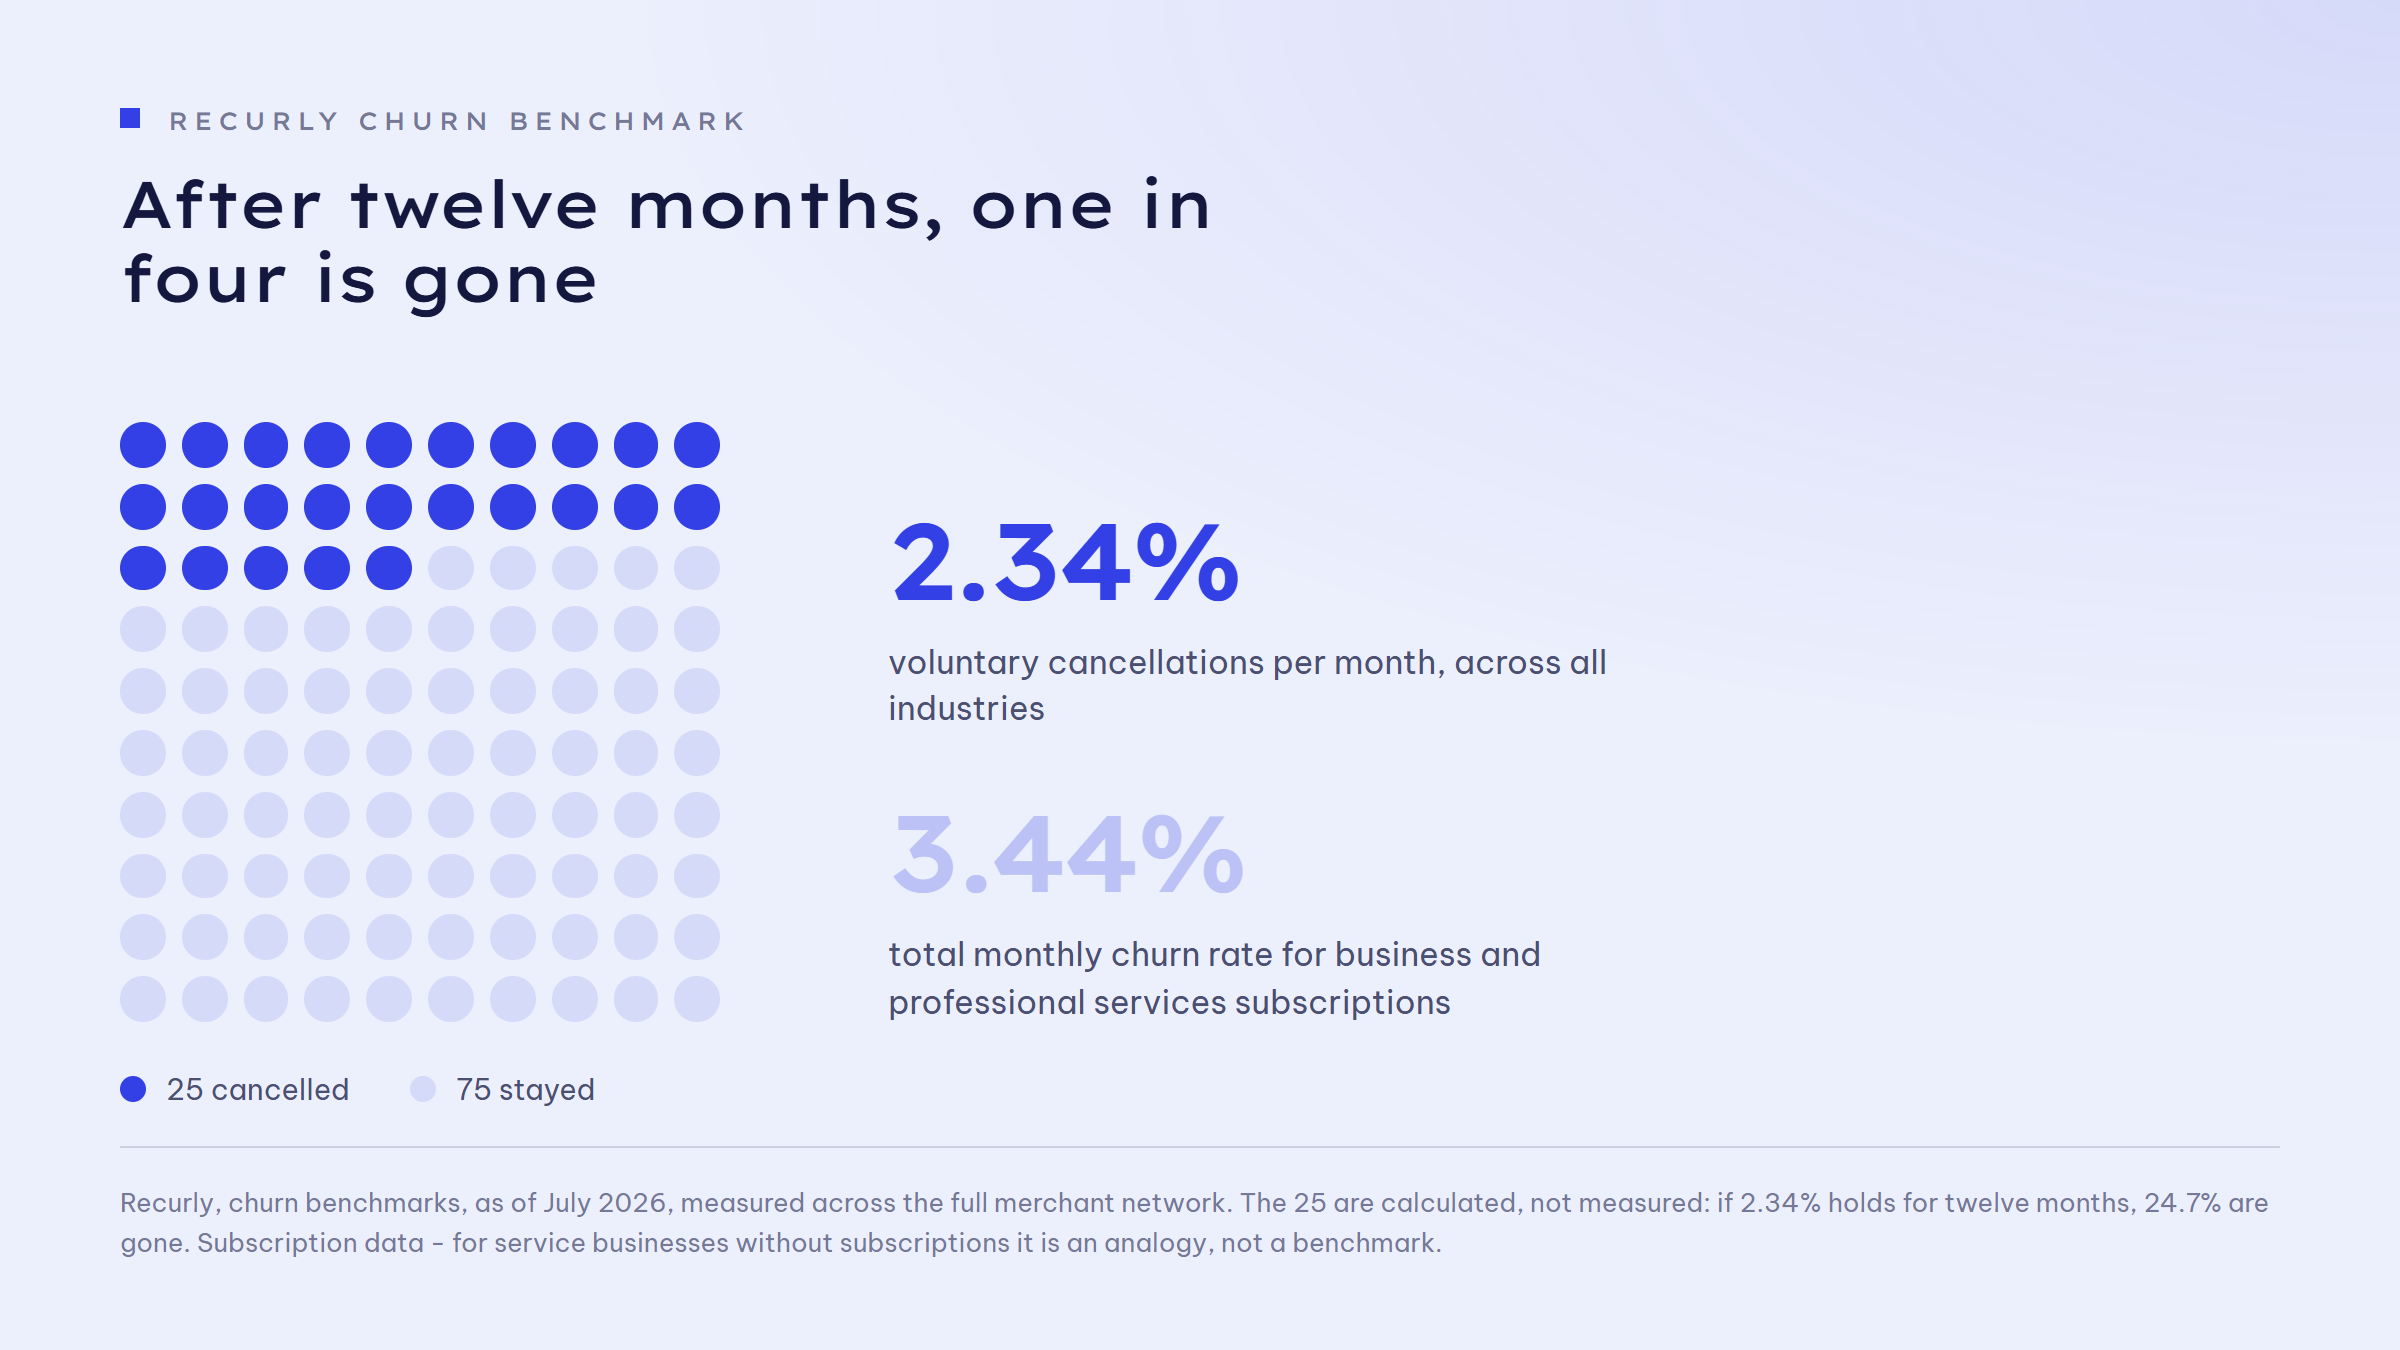
The hardest numbers come from the subscription world, where cancellations are cleanly measured. The billing platform Recurly analyses churn across its entire merchant network and states in its churn benchmarks (as of July 2026): "The single biggest driver of voluntary cancellations is poor onboarding." Customers who do not experience a product's value in the first weeks cancel. Across all industries, voluntary churn averages 2.34 per cent per month there, and for business and professional services subscriptions the total rate of 3.44 per cent monthly is above average.
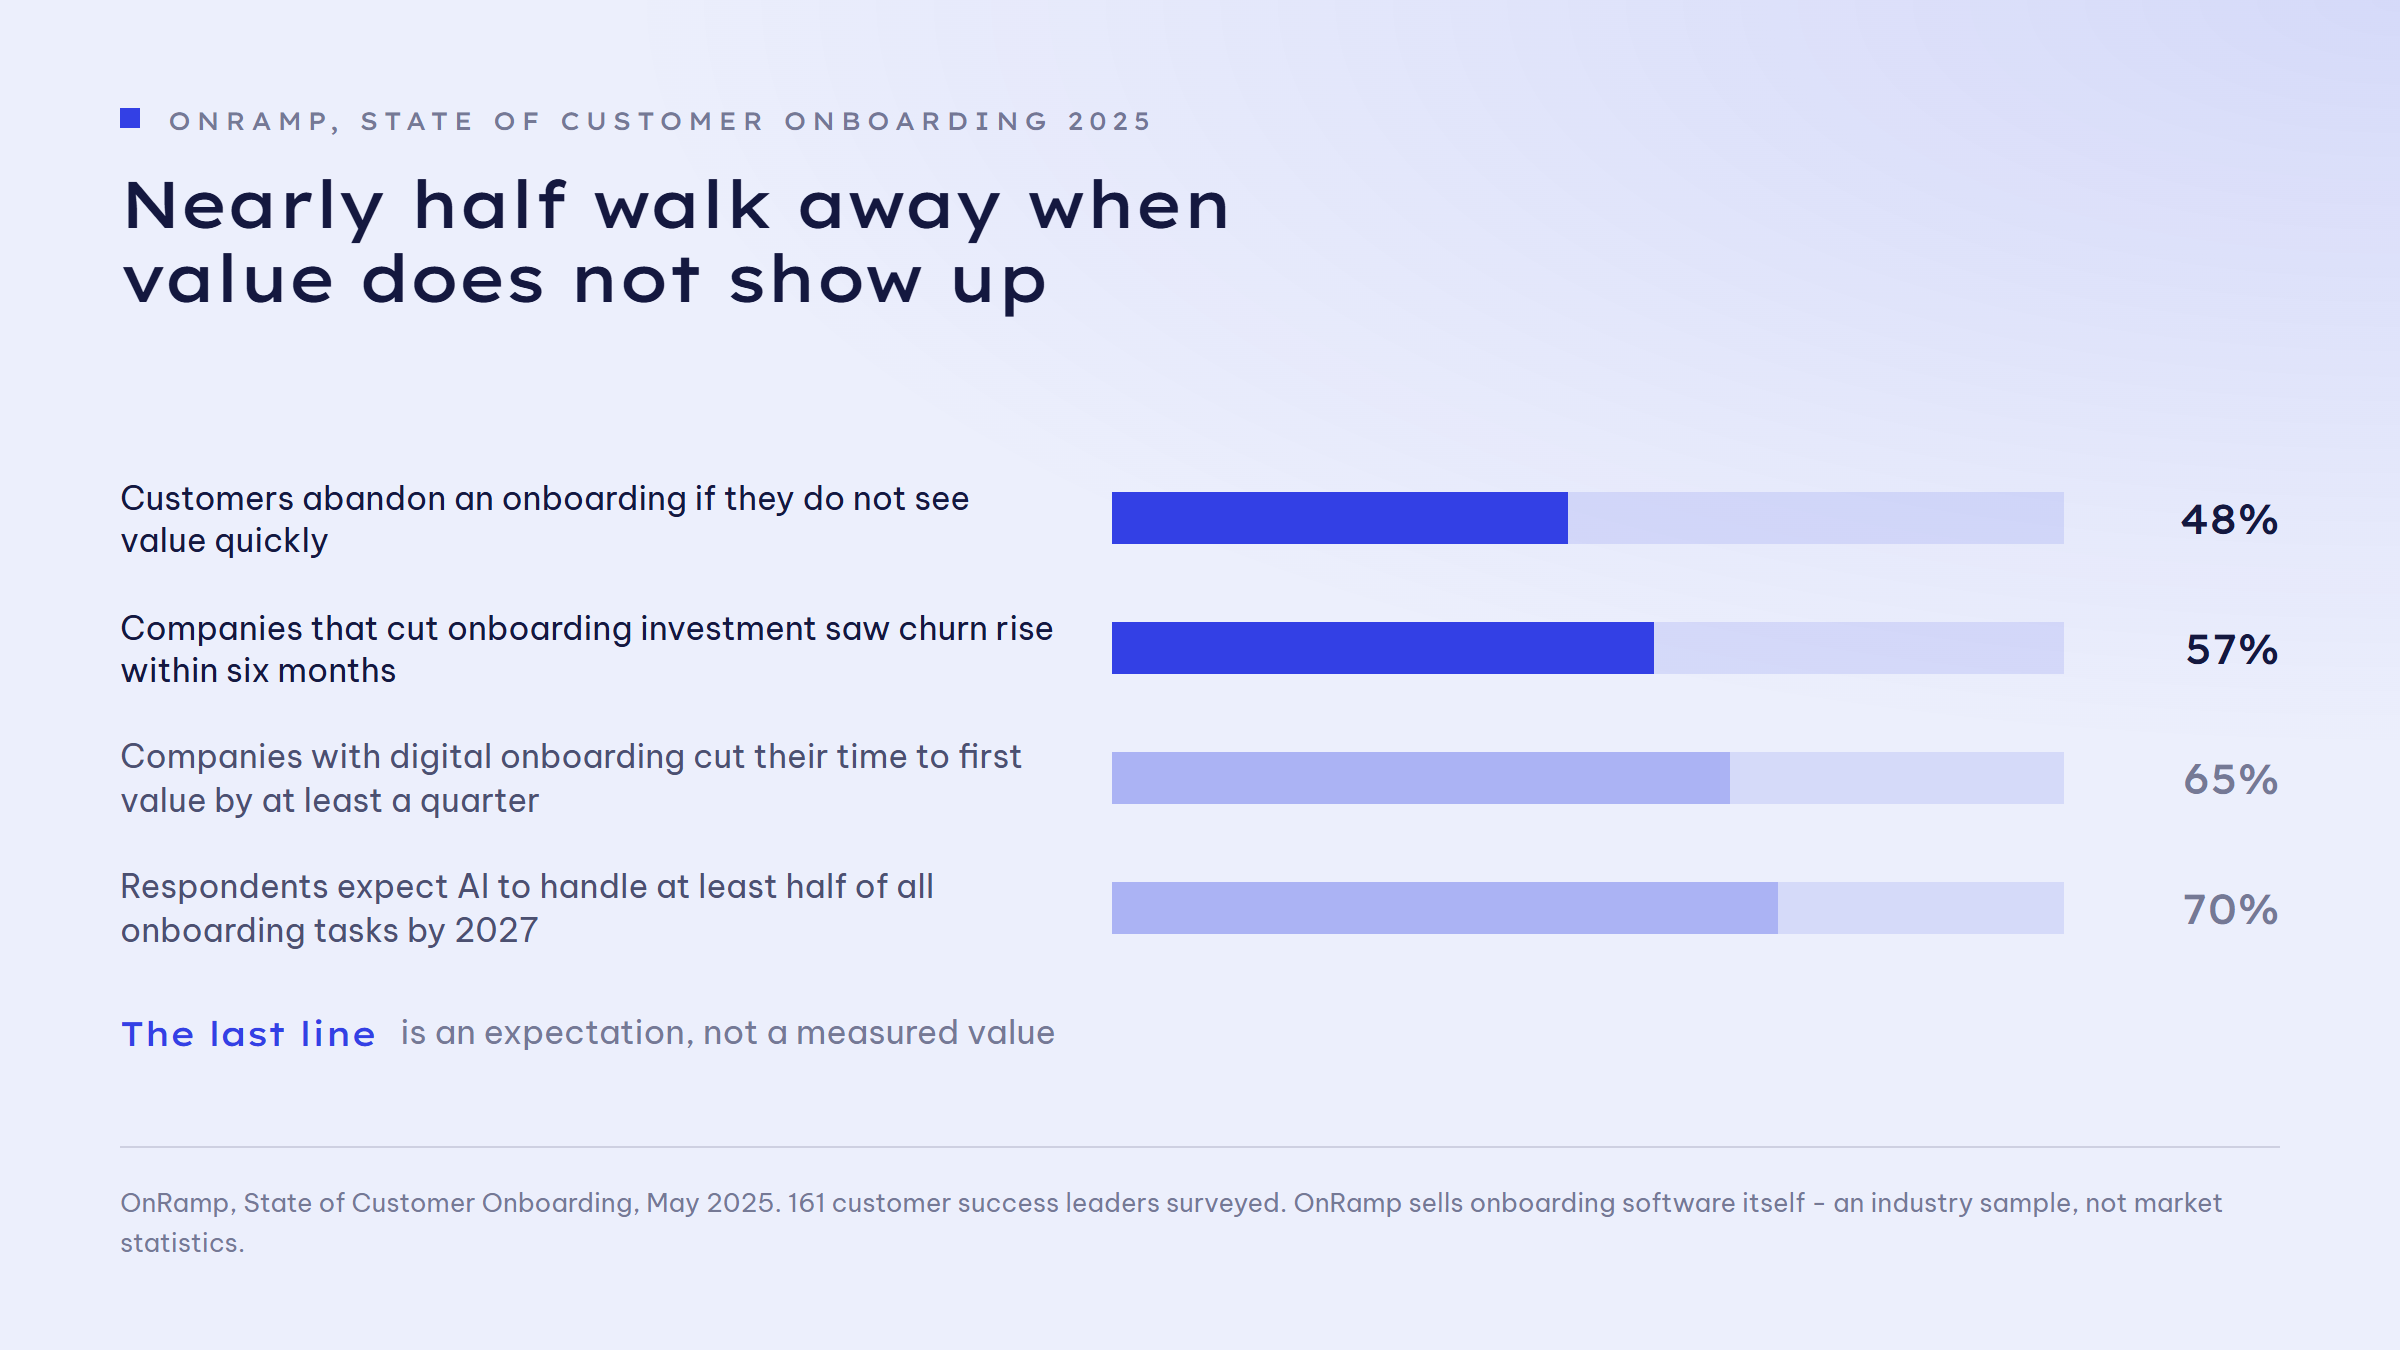
The State of Customer Onboarding report by OnRamp from May 2025 points in the same direction. For context: OnRamp sells onboarding software itself, and the survey covered 161 customer success leaders, which makes it a small industry sample rather than market statistics. Two findings still stand out, because they match what we see in projects: 48 per cent of customers abandon an onboarding if they do not see value quickly, and 57 per cent of companies that cut onboarding investment saw churn increase within six months.
For service businesses without a subscription model, the pattern translates: cancellation does not happen at the push of a button, it happens quietly. The client replies more slowly, the follow-up project never materialises, the referral stays away. The cause sits in those same two weeks in which it is decided whether the signature feels like progress or like a mistake. Something else happens in this phase too: the client gets to know how you actually work, not how the pitch said you work. All the trust that social selling, referrals and your sales process built before the signature is either honoured or squandered in these two weeks. The customer journey does not end at the purchase, it starts over there.
What belongs in the first two weeks - and in what order?
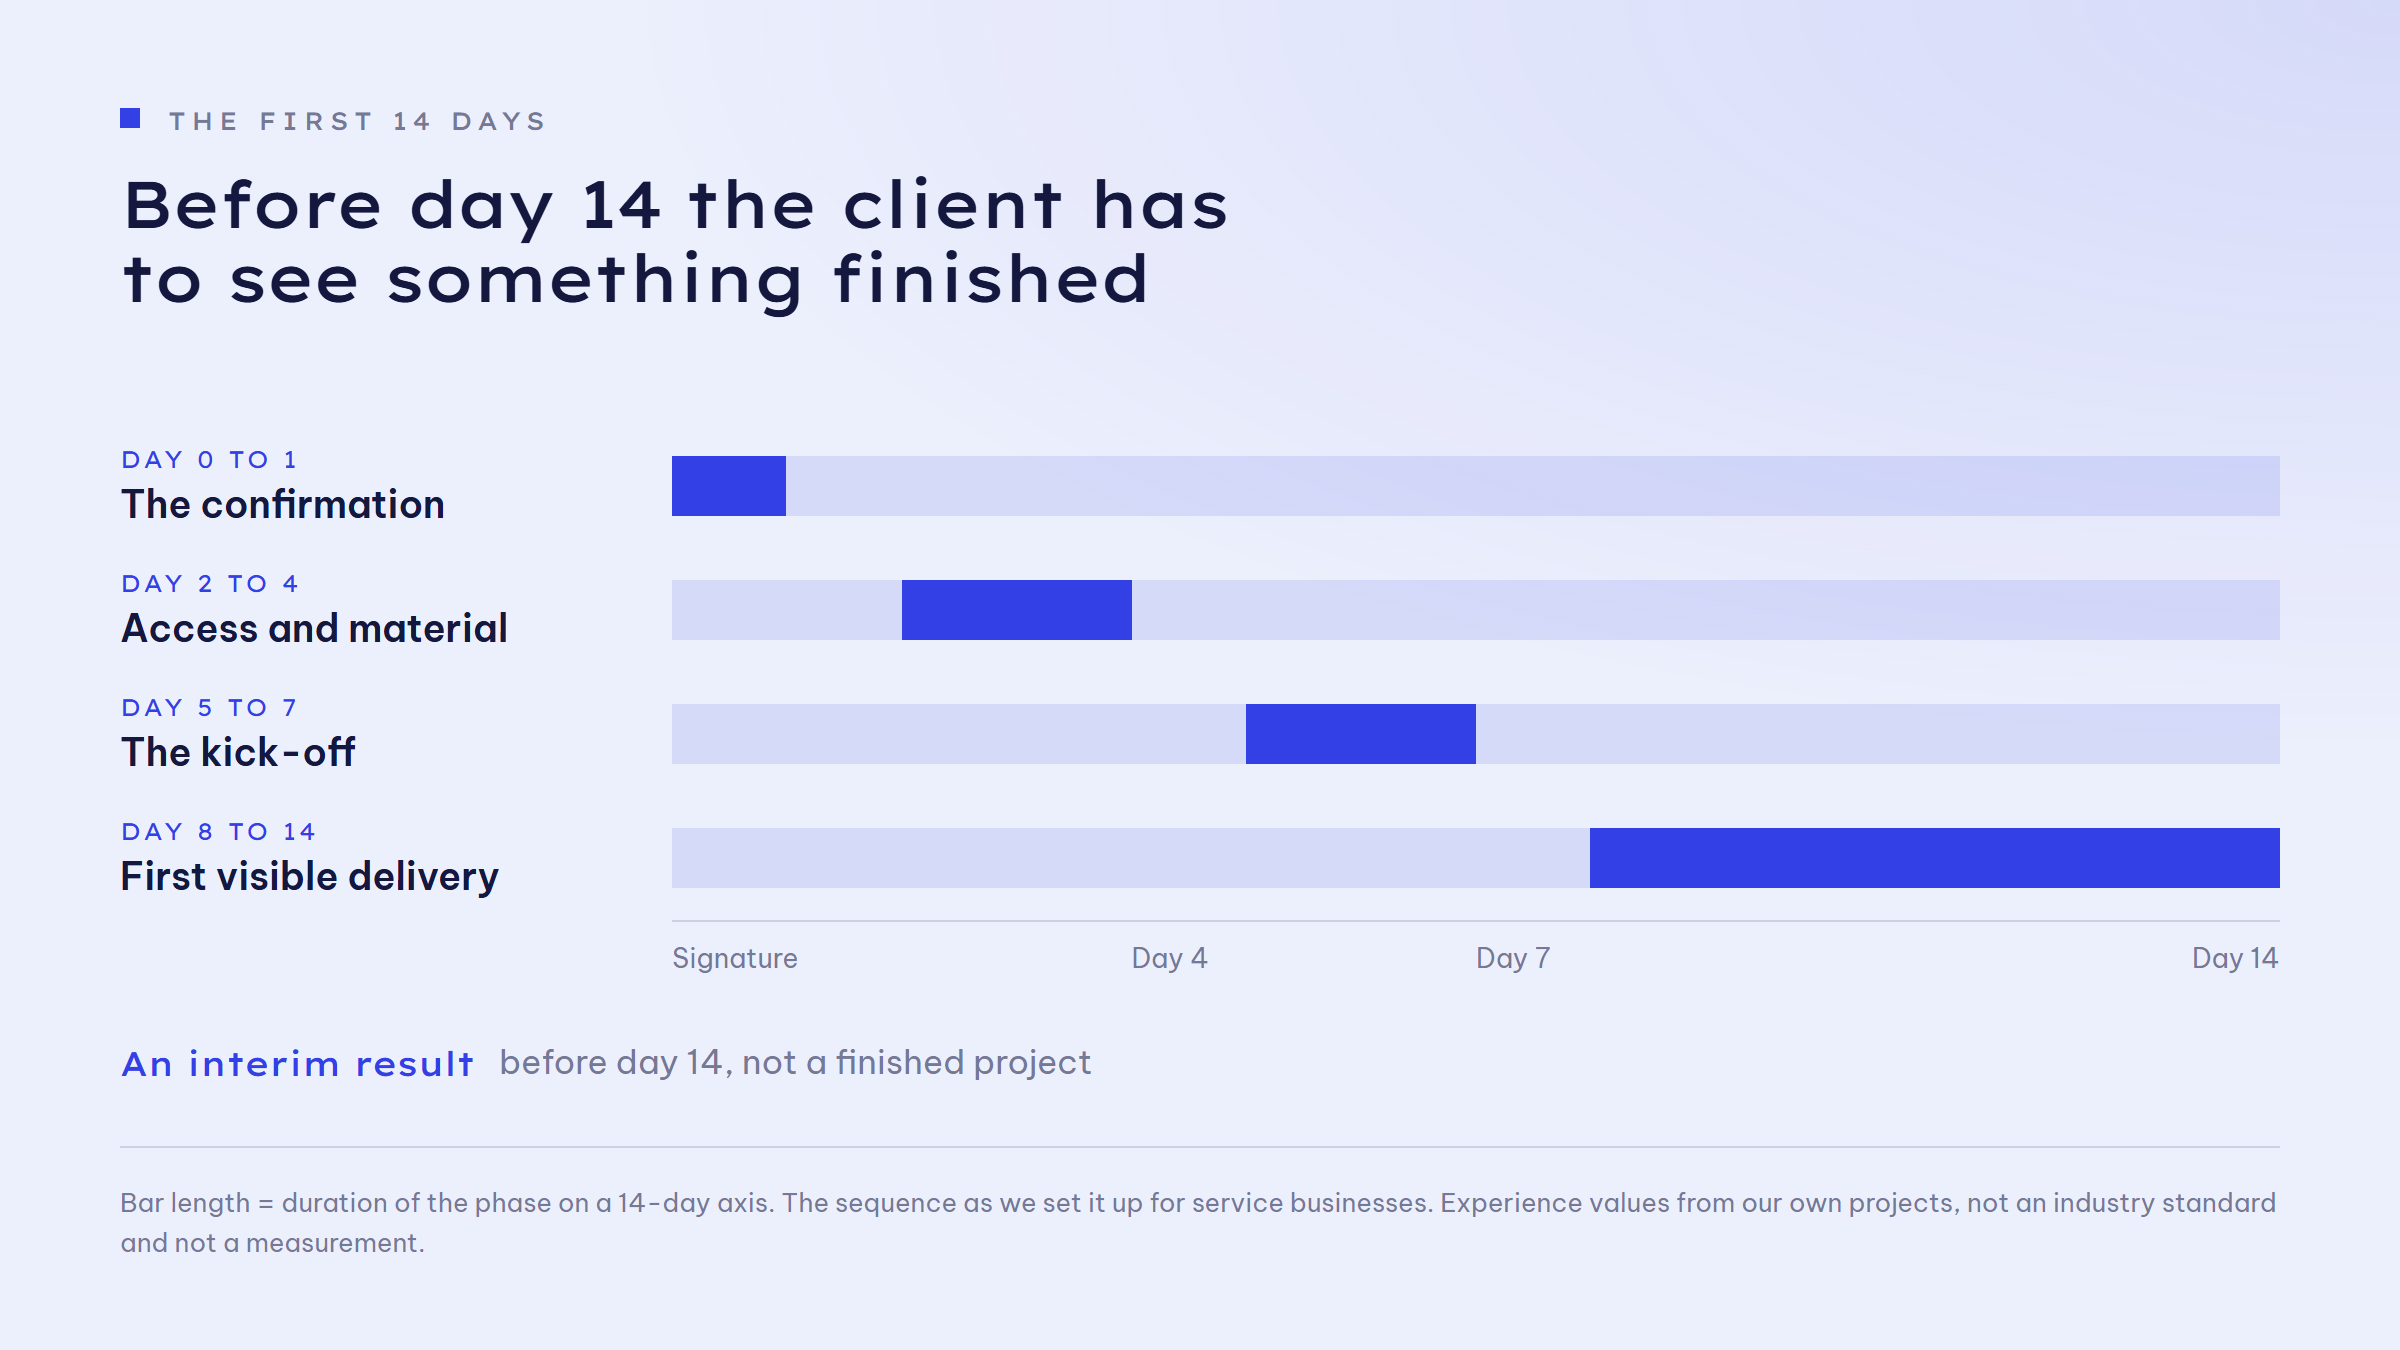
Day 0 to 1: the confirmation. Within 24 hours of signature, the client receives a message that clarifies three things: who their contact person is, what happens next and when. This is deliberately not a marketing email but a working message. The logic of speed to lead continues after the purchase, except that what is at stake now is not the deal but the client's confidence in their decision.
Day 2 to 4: access and material. Almost every project needs credentials, documents, approvals and contact people on the client side. Collecting these via loose emails produces the ping-pong that delays projects by weeks: four follow-ups, three half answers, one forgotten password. A structured checklist the client works through themselves, with a friendly automated reminder, is the single most effective measure here.
Week 1: the kick-off. A meeting in which the contract is not repeated but expectations are calibrated: what is the first visible success, how will both sides recognise it, what do you need from each other, where are the boundaries of the engagement. This meeting is the place where misunderstandings are cheap. In week six they cost budget and nerves.
Before day 14: the first visible delivery. Not the finished project but a real interim result: the tracking set up, the first draft, the cleaned-up data foundation with a short note on what changes because of it. In the Wyzowl onboarding survey from 2020 (216 respondents, small and no longer fresh, but plausible in its direction), 86 per cent said they would stay more loyal to a provider that invests in educating them after the purchase, and over 90 per cent felt the companies they buy from could do better at it. The bar is low. A visible result before day 14 is often enough to stand out.
Which steps can you automate - and which ones should you not?
The line runs between process and relationship. Everything that always runs the same way can be automated: the welcome message with next steps, the access checklist including reminders, the booking link for the kick-off, creating the project in the CRM, status updates when a milestone is reached. Technically this is a nurture sequence after the purchase: a defined series of messages and tasks that starts with the signature and ends when the project is running. The marketing automation that developed leads before the deal can do the same work for onboarding after it.
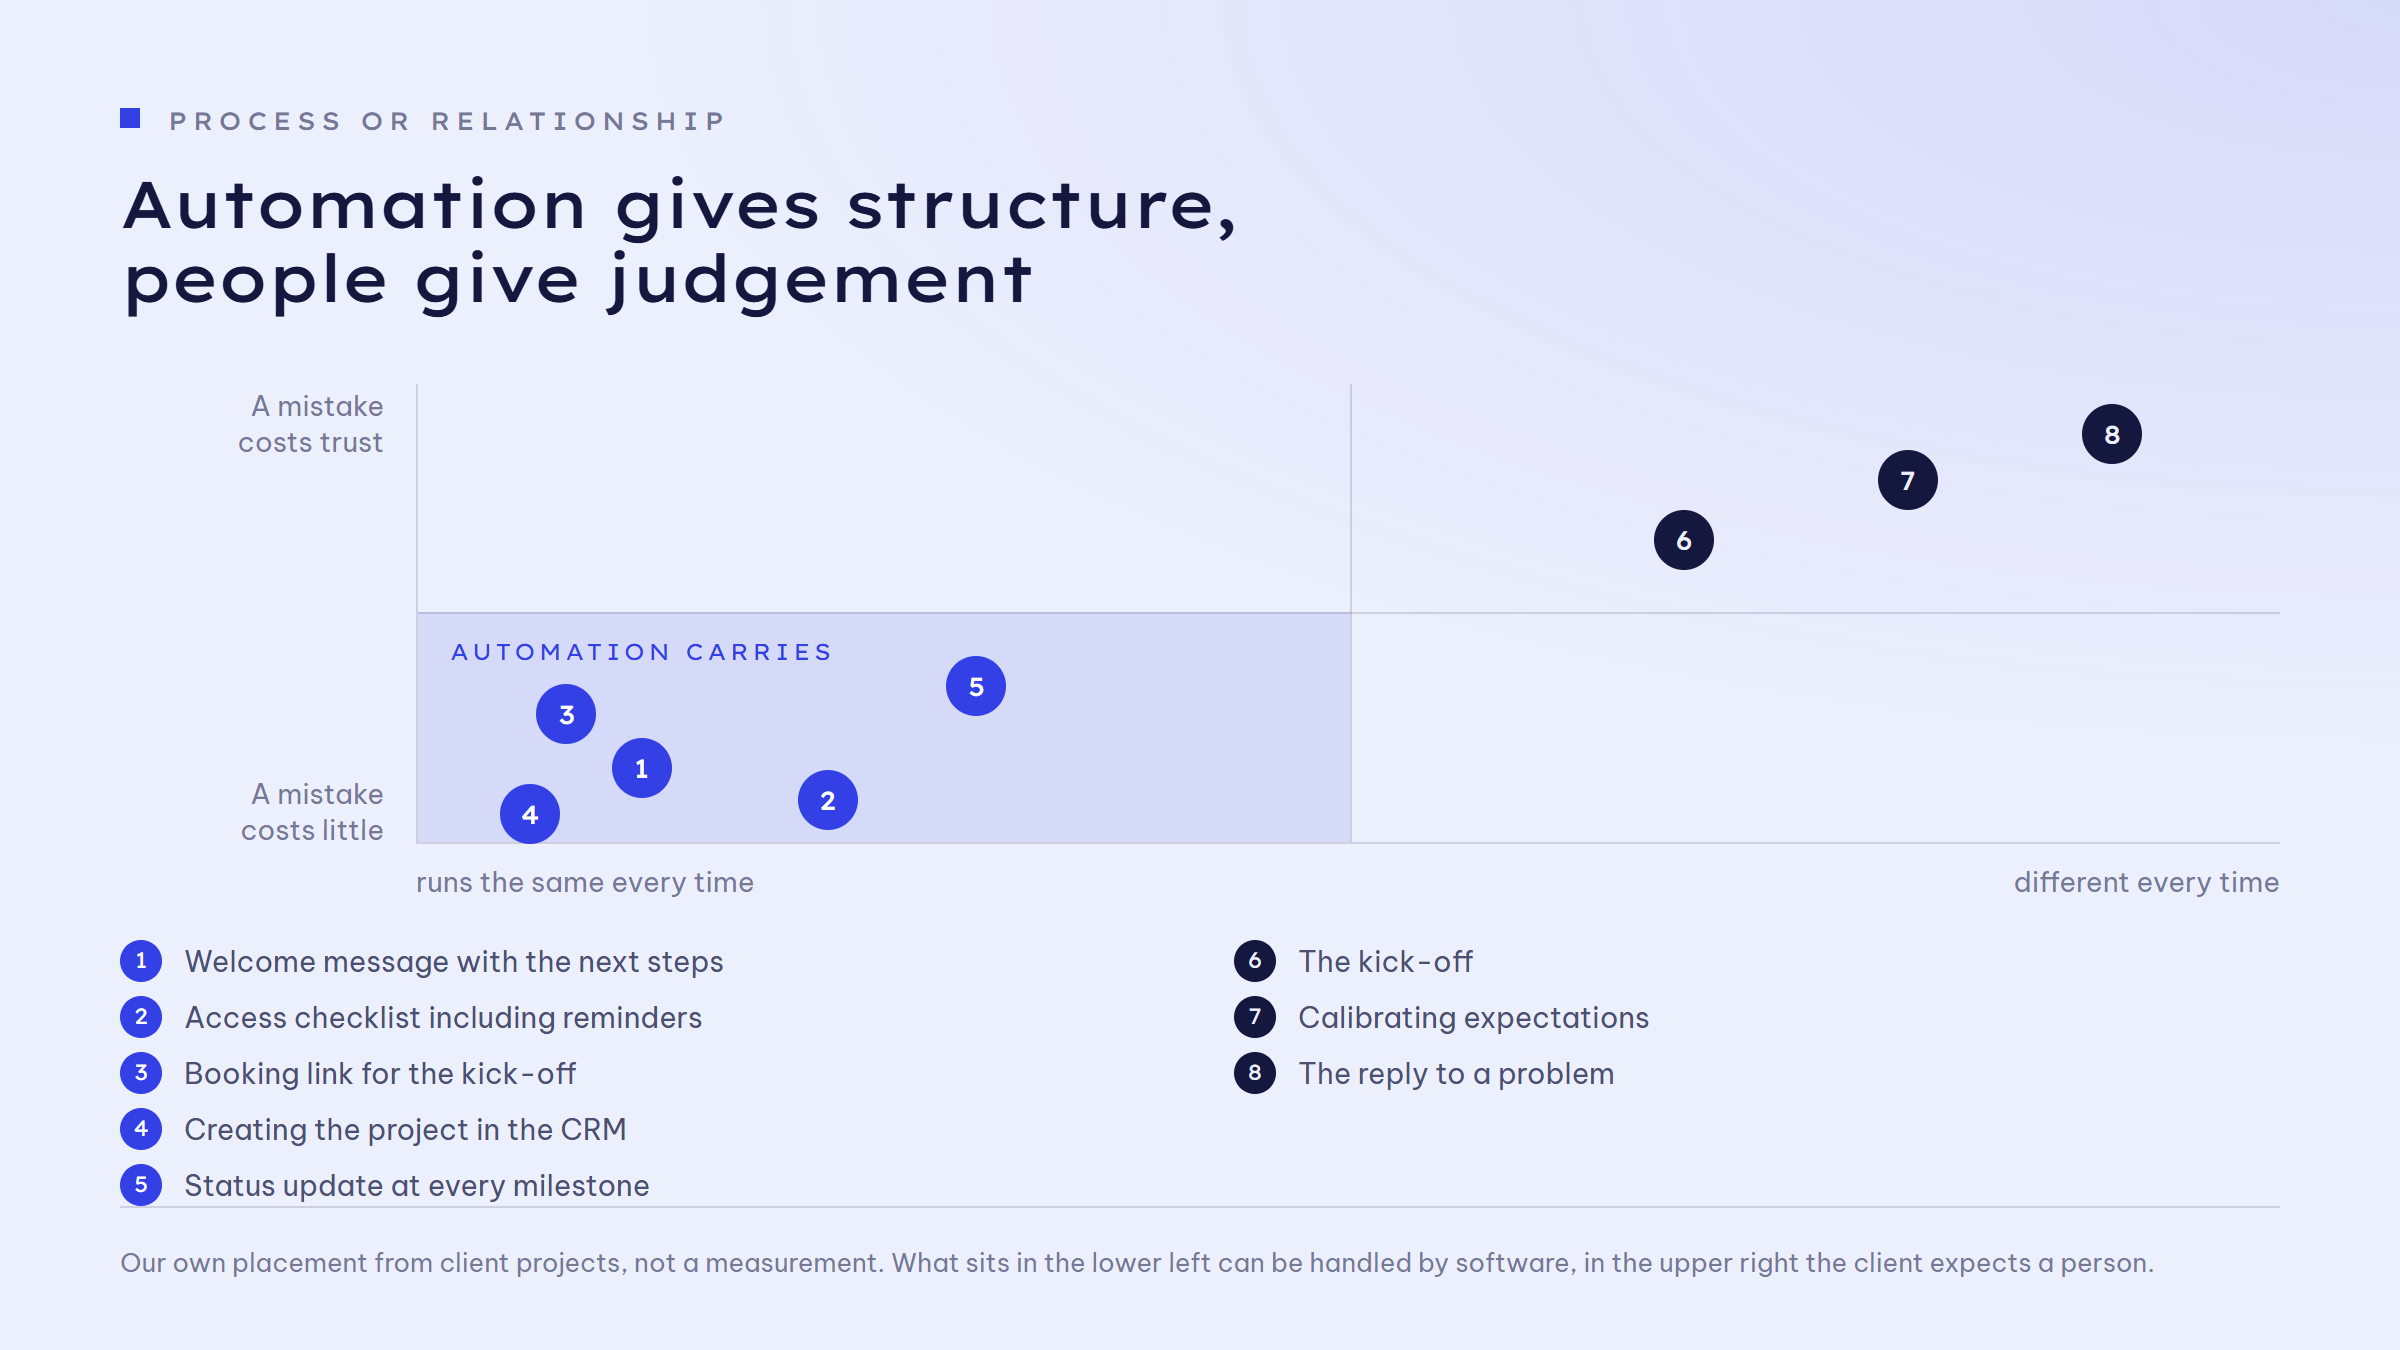
What you should not automate are the three moments in which the client expects a person: the kick-off, the calibration of expectations and anything that looks like a problem. An automated reply to a worried question is worse than a slow personal one. The rule of thumb: automation delivers the structure, people deliver the judgement.
That the shift is heading this way is also visible in the OnRamp report, with the same caveat as above: 65 per cent of companies using digital onboarding report cutting their time to first value by at least a quarter, and 70 per cent of the customer success leaders surveyed expect AI to handle at least half of onboarding tasks by 2027. Whether it plays out that way is open. That the mechanical half of onboarding can be automated is something you can use today.
How do you measure whether your onboarding works?
Four metrics are enough, and you can collect them without new software. First, the time to the first visible result, measured from signature, not from kick-off. Second, the turnaround time of the checklist: how long does the client take until access and material are complete? If that regularly takes longer than a week, the checklist is too long or too unclear. Third, the number of clarifying questions per project start, because every question points to a gap in your structure. Fourth, at a distance, the early churn rate or its service-business equivalent: how many clients do not extend after the first project?
Honesty requires saying: for agency and service onboarding there are hardly any industry benchmarks worthy of the name. The usable numbers above come from the subscription world, and what is measured there is an analogy for service businesses. The practical path is therefore not comparing yourself with someone else's number but with your own: measure the four metrics once now, change one thing, measure again in three months.
Three levers for this week
Lever 1: Build the access checklist. One page, one form, every credential and document a new project needs, with an automated reminder after three days. That is one afternoon of work, and it pays itself back in every single project.
Lever 2: Write the welcome sequence. Three messages: confirmation with contact person and next steps within 24 hours, checklist link on day 2, kick-off invitation with a booking link. No advertising, no filler, just orientation.
Lever 3: Schedule the first quick win. For every new project, define what the client will see before day 14 and enter it as a deadline like a client meeting. If you cannot name a quick win before day 14 for a project, that is a warning sign about the project's shape, not about the calendar.
If you would like an outside view of your onboarding: we build these workflows for service businesses, from the form to the automation behind it. Book a call and we will walk through your first 14 days together. 🧭