
Almost every website has one: the page with the logos, three sentences of praise and the line "we were able to significantly improve efficiency". And almost none of them sells. Case studies that sell work differently - they deliver verifiable proof at the point where nobody is talking to you yet. That is exactly where the decision is made, as data from nearly 4,000 B2B buying processes shows. Let us look at what buyers actually check, how a defensible case study is structured, and which numbers you are allowed to put on the page.
Why do most references convince nobody?
Because they were written in a year when producing content became practically free. The B2B trends report from Content Marketing Institute and MarketingProfs (16th annual survey, fielded 24 June to 14 August 2025, 1,015 B2B marketers) shows the pattern plainly: 95 per cent of organisations use AI-powered applications, 89 per cent of them for content creation. 87 per cent report better productivity - but only 39 per cent say the performance of their content improved. More output, same effect.
The top challenge in the same report fits neatly: 40 per cent name creating content that prompts the desired action as their biggest problem, and 33 per cent struggle to measure content effectiveness at all. Reference pages are where that problem gets most expensive. They sit at the bottom of the funnel, just before the enquiry - and if they merely claim instead of evidencing, you waste the moment when somebody has almost bought from you already.
When is the purchase actually decided?
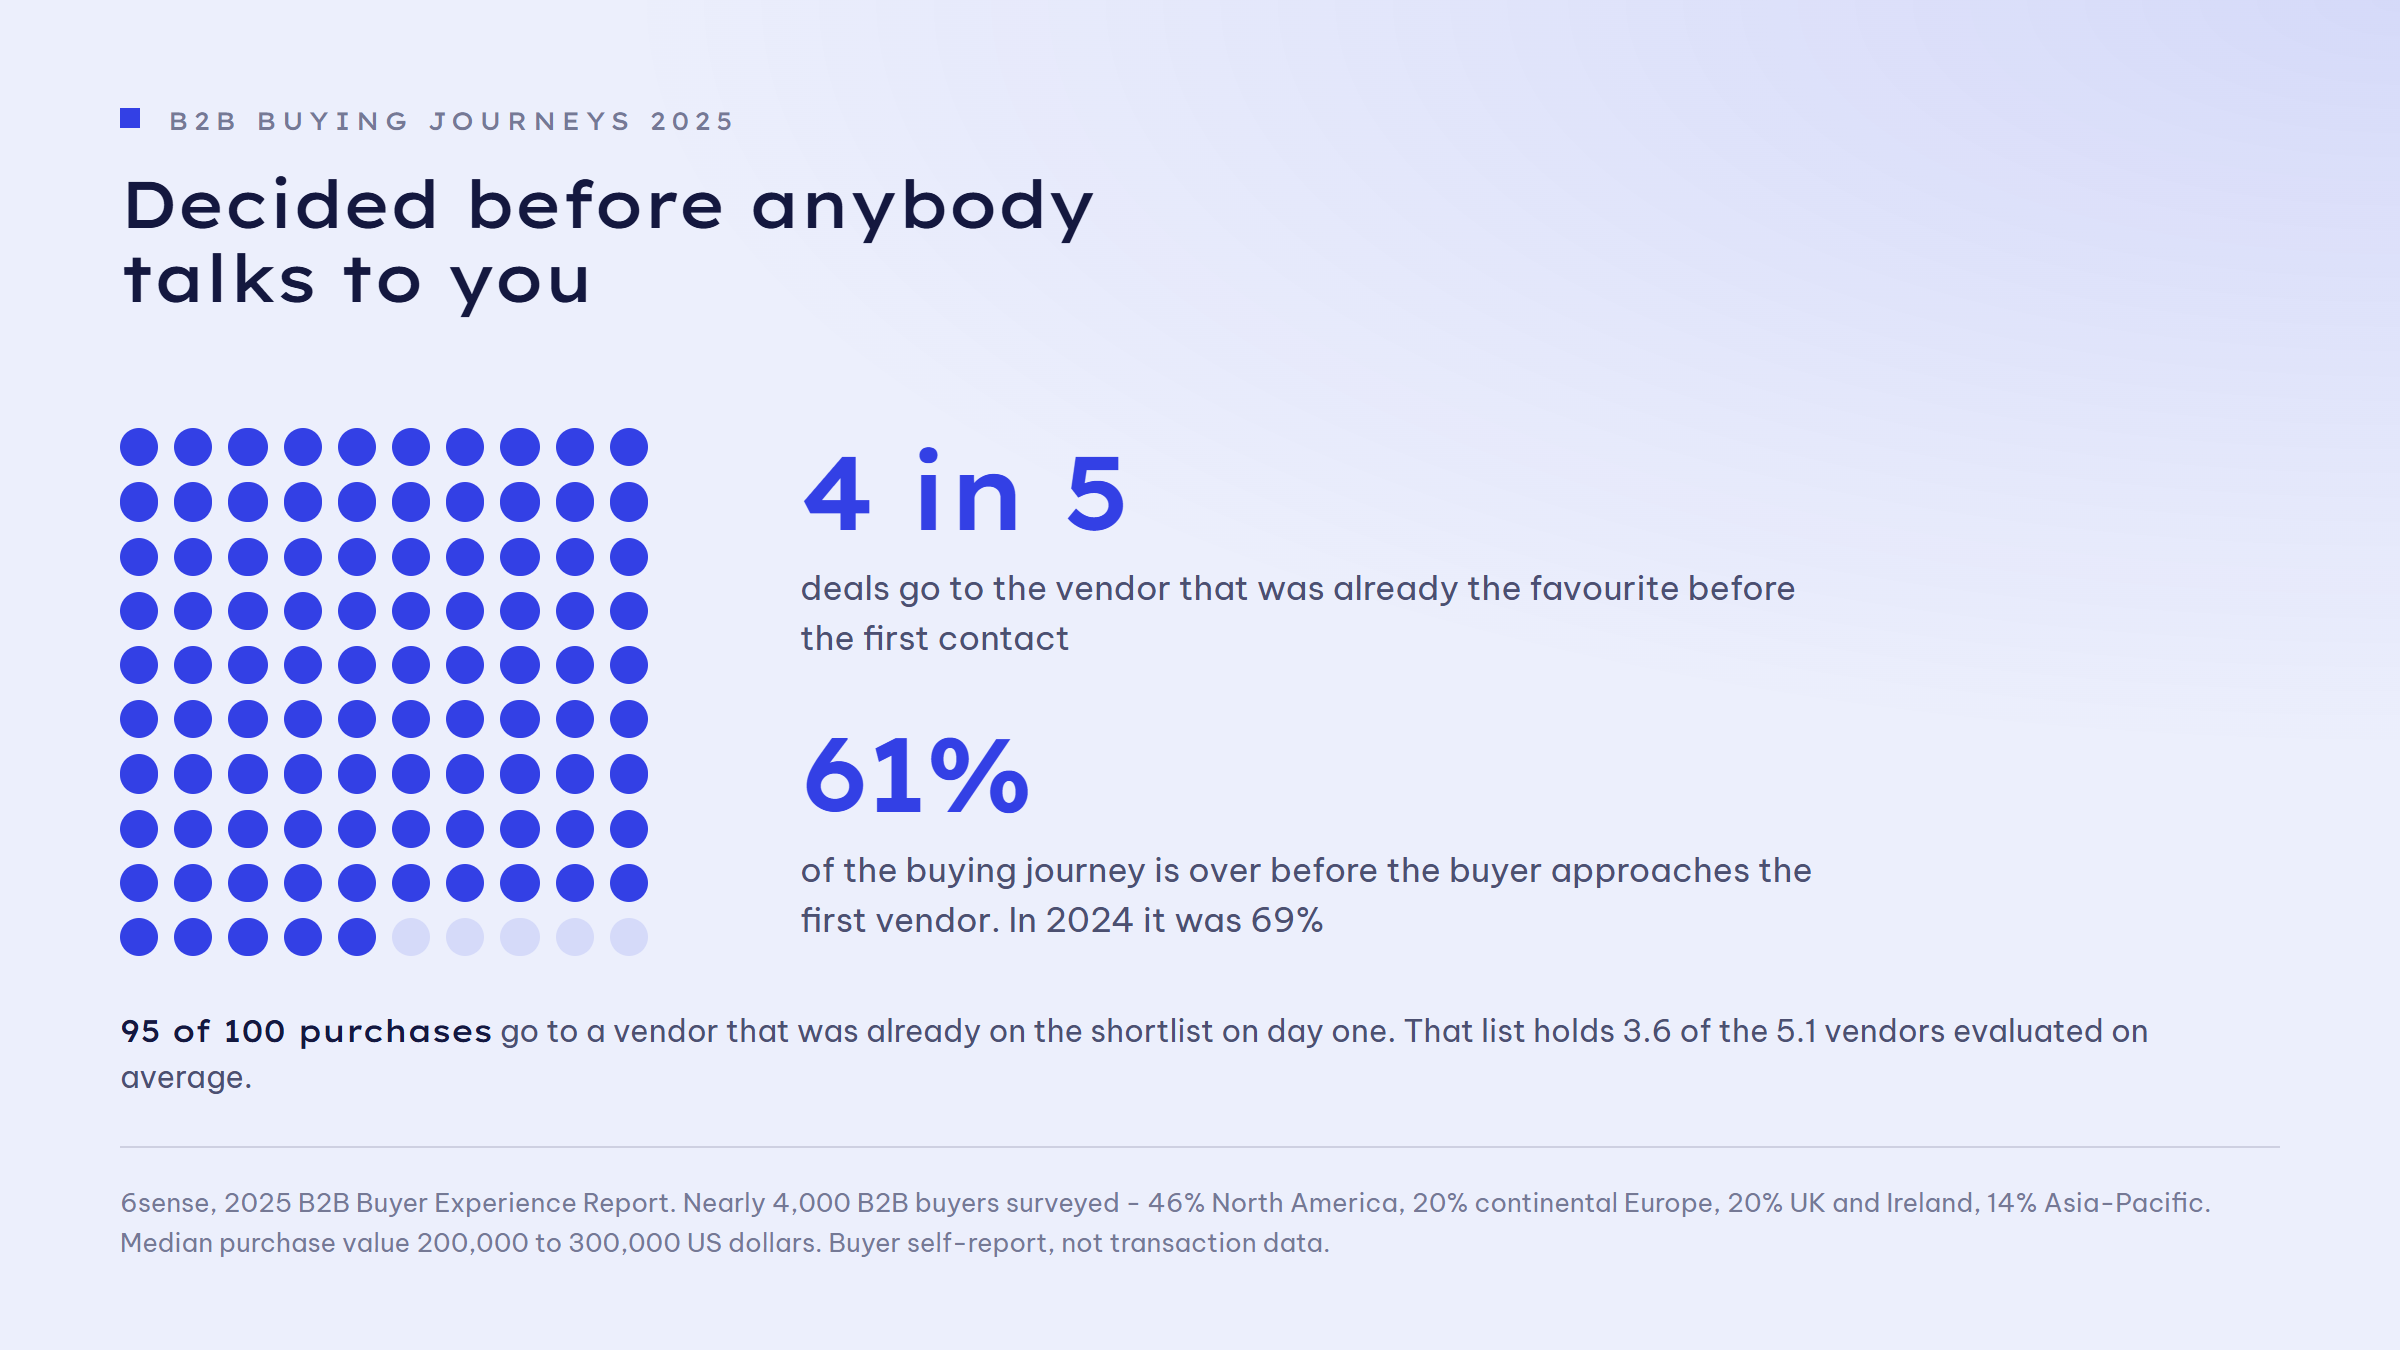
Earlier than most marketing plans assume. The 2025 B2B Buyer Experience Report by 6sense (just under 4,000 responses, 46 per cent North America, 20 per cent continental Europe, median purchase value 200,000 to 300,000 US dollars) puts it bluntly: 95 per cent of the time the eventual winner is already on the Day One shortlist, and four out of five deals are won by the pre-contact favourite. Of 5.1 vendors evaluated on average, 3.6 shortlist places are filled on the first day. The point of first contact has also moved from 69 to 61 per cent of the journey - buyers get in touch earlier, but their ranking is already set.
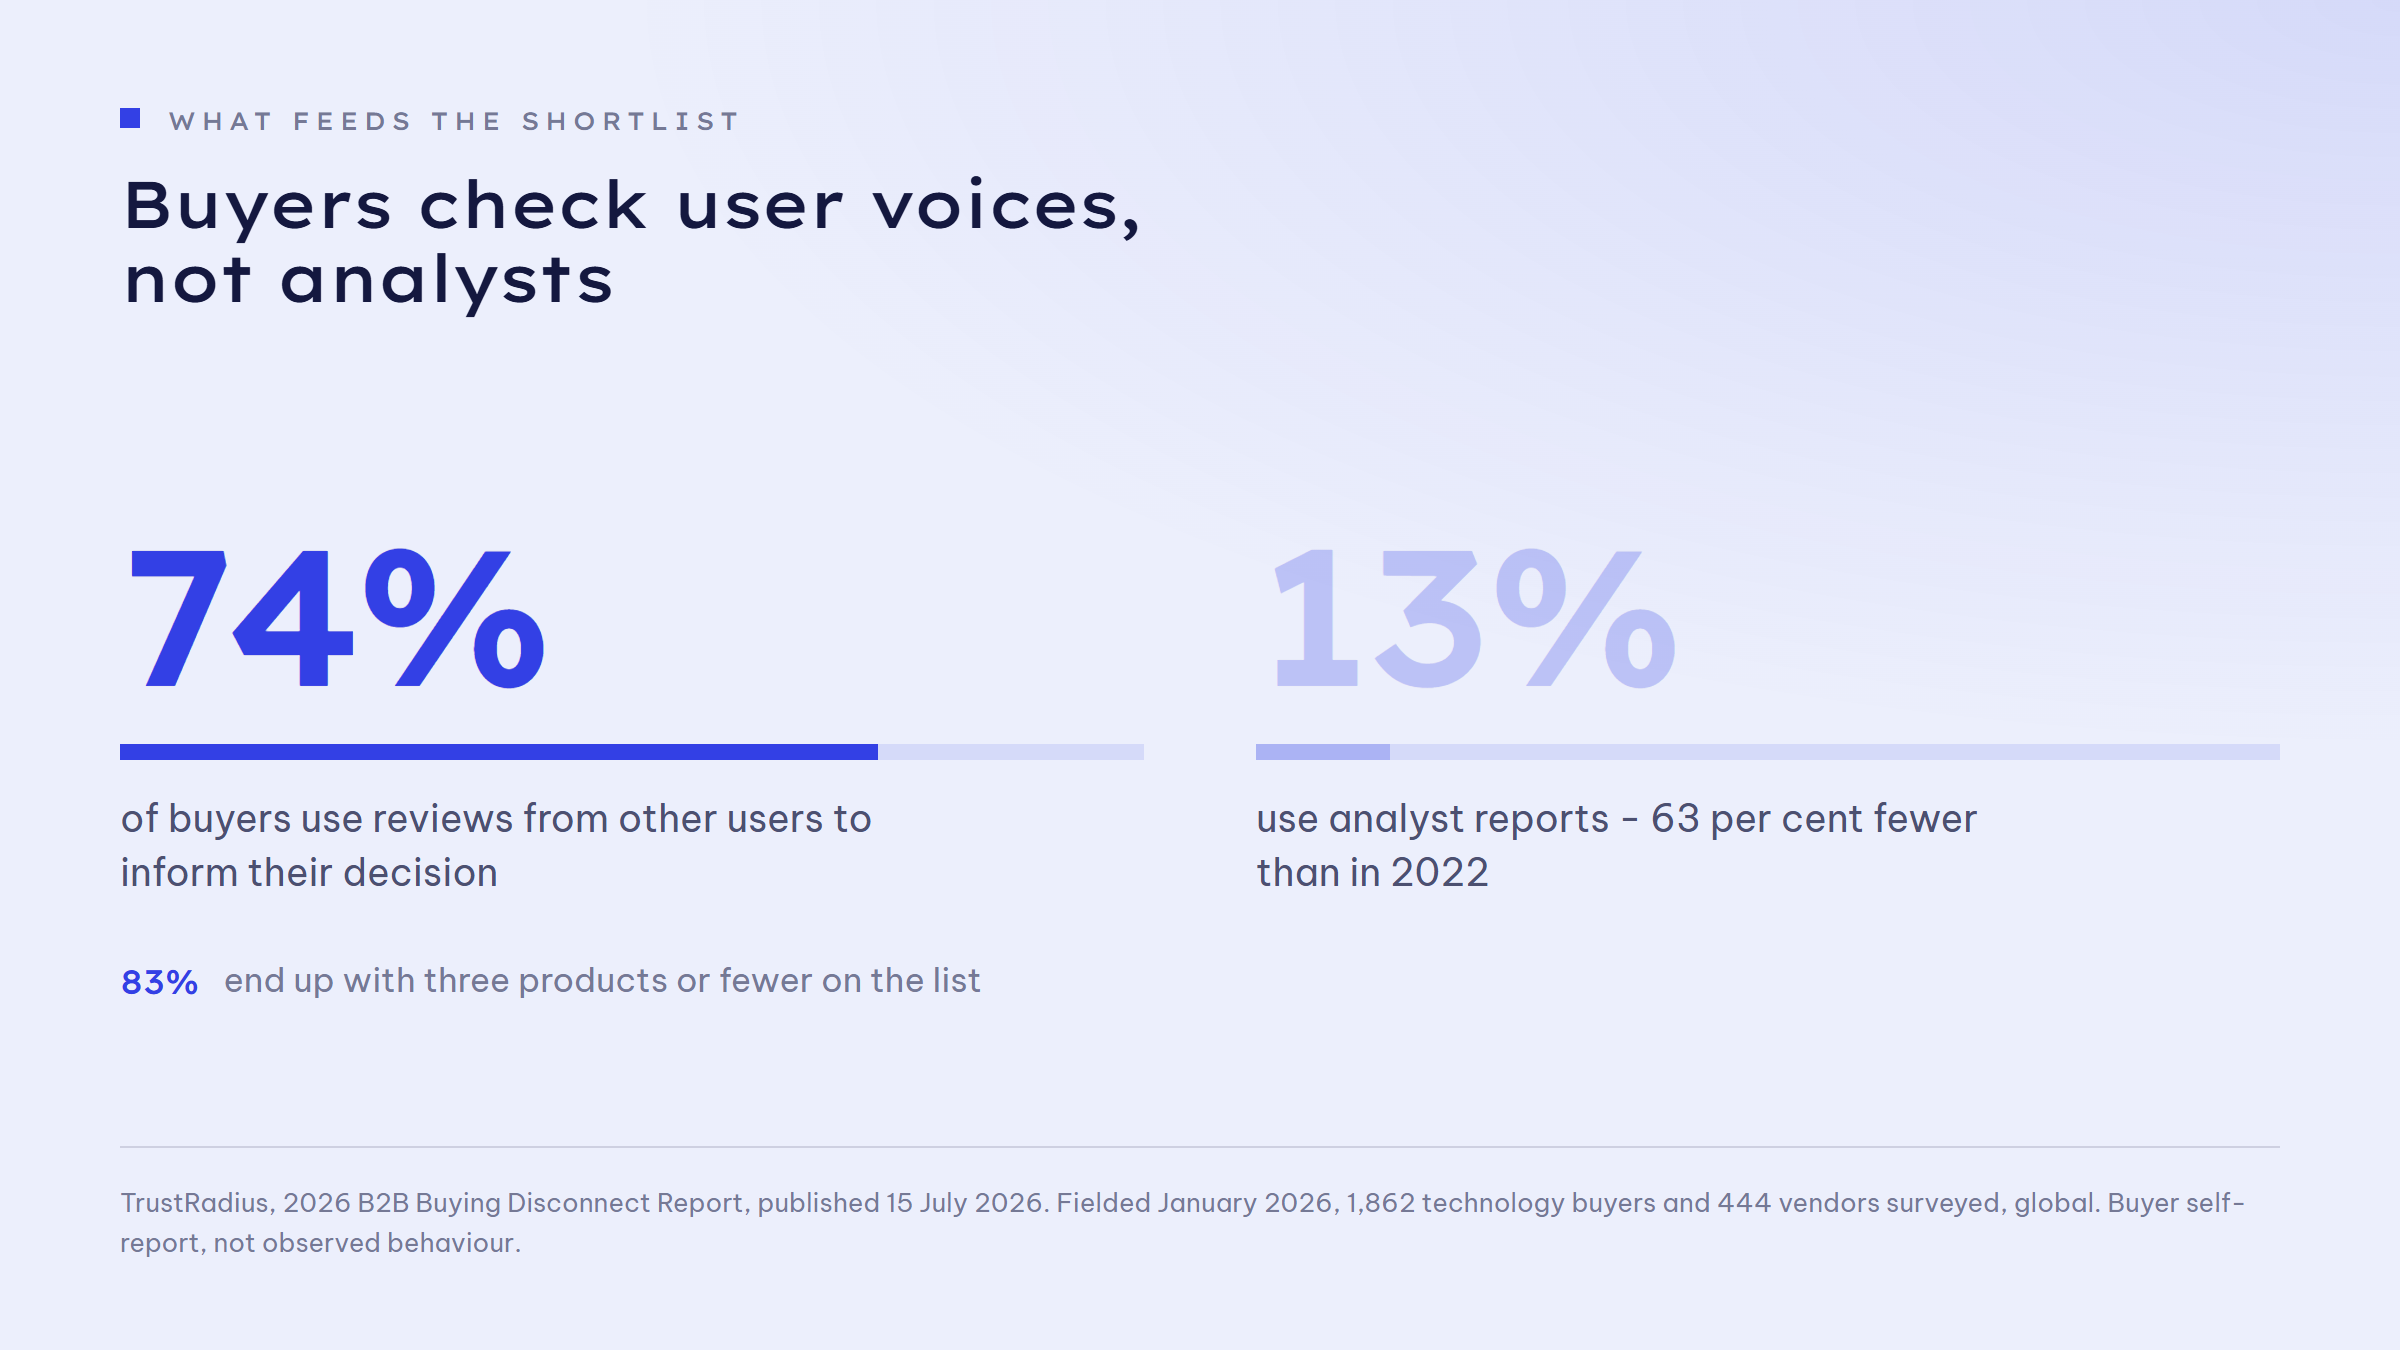
What feeds that ranking is visible in the 2026 B2B Buying Disconnect Report by TrustRadius (published 15 July 2026, 1,862 buyers and 444 vendors surveyed, fielded January 2026): 74 per cent of buyers use reviews to inform their decision, and 83 per cent end up shortlisting three products or fewer. Analyst reports, by contrast, have fallen to 13 per cent usage, a 63 per cent decline since 2022. The strongest influences, per the report, are demos, free trials, prior experience and user voices - everything that looks like proof rather than a brochure. A good case study is the only form of social proof you can shape yourself without making it implausible.
How do you build a case study that holds up?
In six blocks, always in this order. First, the starting position with a number: not "the processes were inefficient" but "four people spent 12 hours a week copying quotes by hand". Second, the decision situation - which options were on the table and why the obvious one was rejected. Third, the implementation, with enough technical detail that specialists can judge the effort. Fourth, the outcome, with a time frame, a measurement method and a baseline. Fifth, the limits: what did not work, what took longer, what was a precondition. Sixth, a quote with full name, role and company.
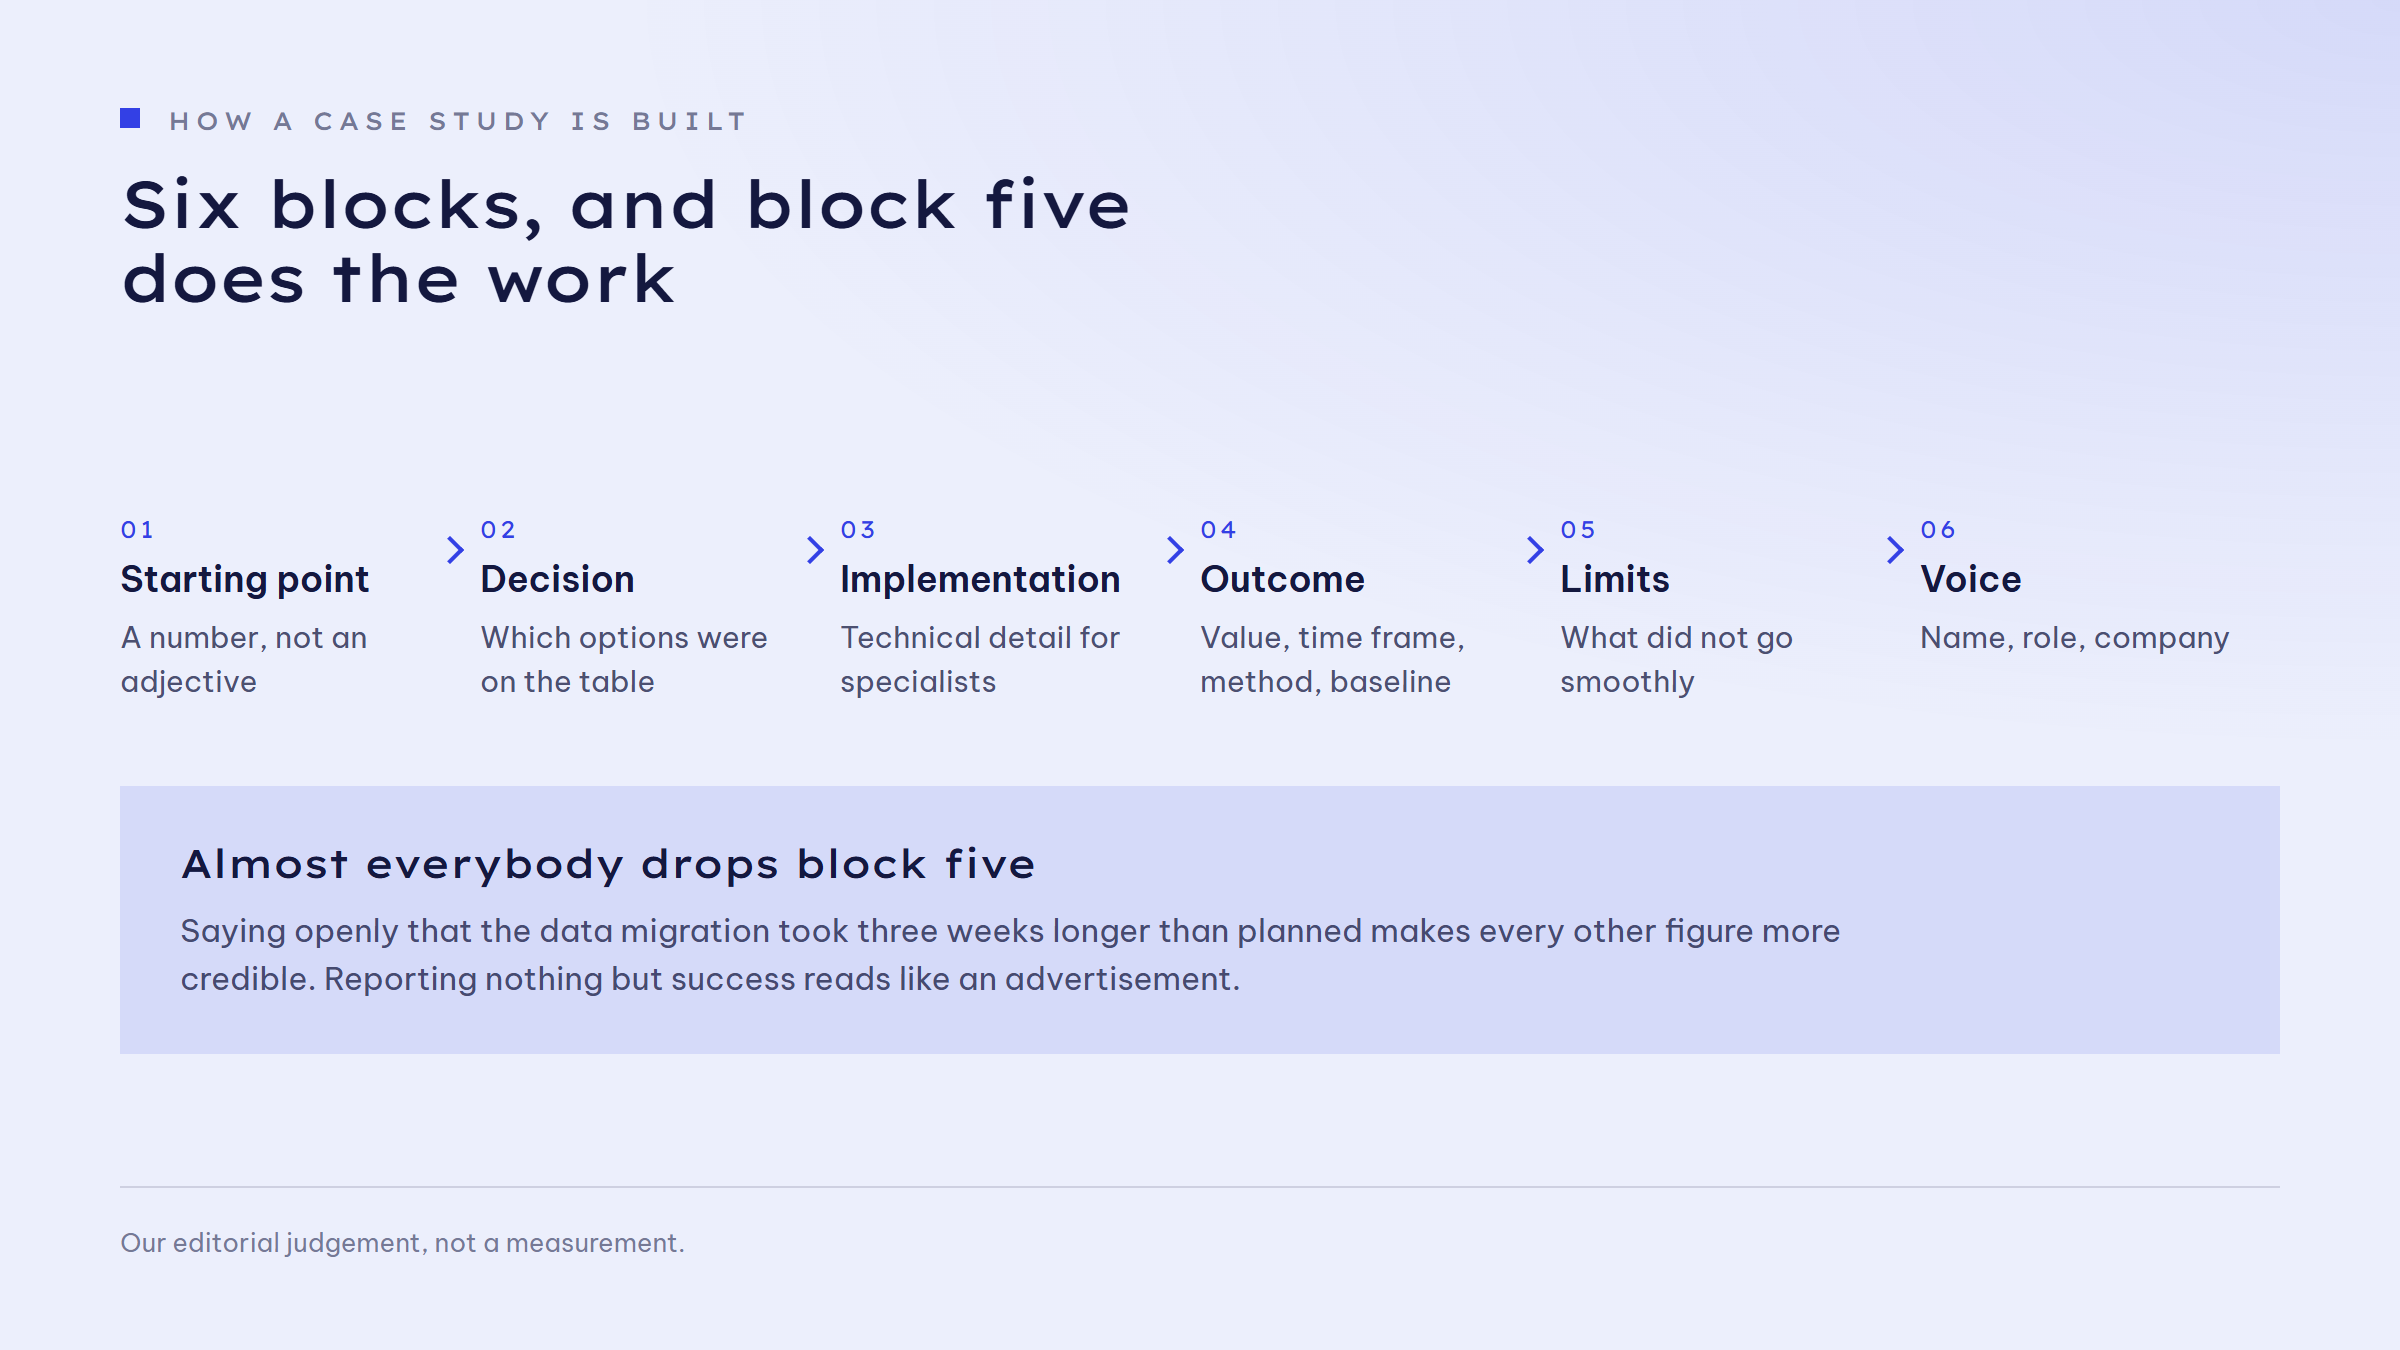
Block five is the one almost everybody omits - and the one that earns the most trust. Saying openly that the data migration took three weeks longer than planned makes every other figure more credible. Reporting nothing but success reads like an advertisement. The same logic applies to length: a case study does not need 2,000 words, but it does need verifiable substance. If you notice yourself filling the results section with adjectives, you do not have a writing problem, you have a measurement problem - in which case measuring comes first, not writing. One intermediate step helps: before you write, have the client confirm which number they themselves would carry in public. Whatever they will not confirm does not go on the page.
Which numbers are you allowed to claim?
Only the ones you can evidence - and in Germany and Austria that is not a matter of taste. Section 5 of the German Act against Unfair Competition (UWG) prohibits misleading commercial practices, including towards other businesses: false statements about essential characteristics of a service are unfair by law. For consumer reviews, the legislator has gone further. Section 5b(3) UWG requires disclosure of whether and how a business ensures that published reviews come from consumers who actually used or bought the service. The annex to the UWG makes clear in item 23b that claiming reviews stem from real users without reasonable verification is unlawful, and in item 23c that fake reviews are prohibited outright.
Legally, a case study is not a consumer review. But the direction of travel is unmistakable: unevidenced proof claims are a legal risk, not merely a credibility problem. In practice that means three things. First, every number gets a time frame and a source, if need be "measured in the client's CRM, January to June 2026". Second, percentages without a baseline are worthless - "40 per cent more enquiries" from 5 to 7 is a different story than from 500 to 700. Third, when a figure is missing, you write a dash rather than an estimate.
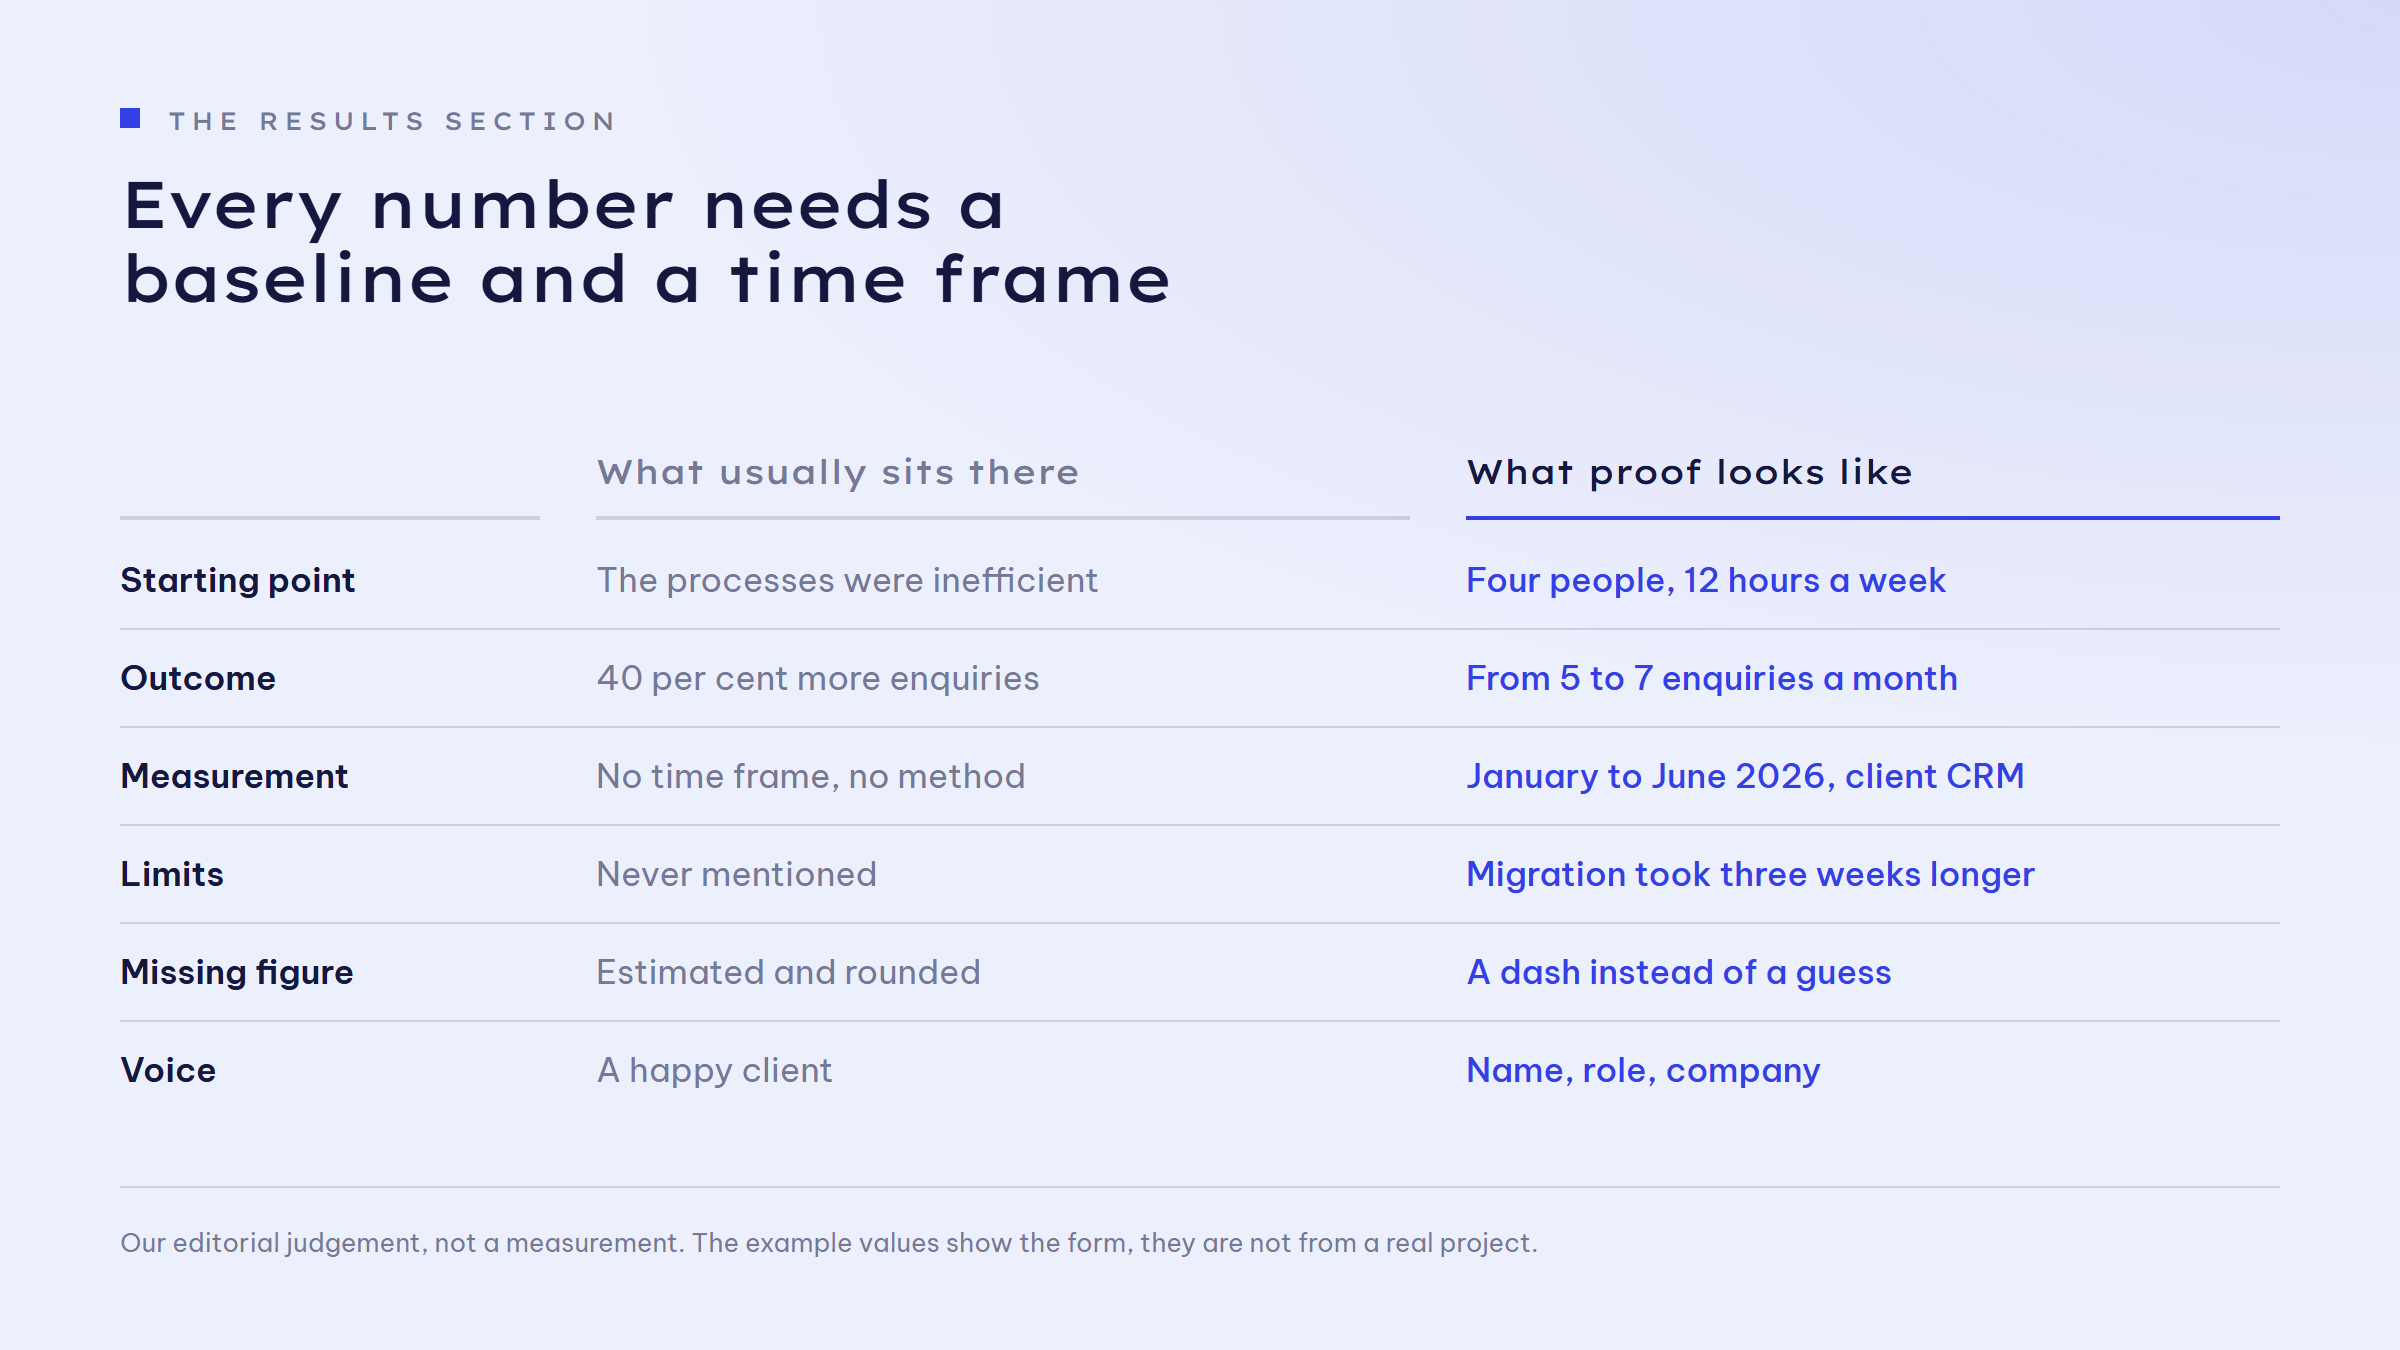
Then the question of which metric proves anything at all. Conversion rates from four weeks are noise. It gets defensible with numbers that need time: churn rate shows whether an outcome still holds after twelve months, and Net Promoter Score shows sentiment over time rather than in a single snapshot. Both belong in a case study - but only with the collection date and sample size next to them, otherwise they are decorative. Showing metrics without context does the same job as the logo wall, just with digits.
How is the case study found - and how does an AI cite it?
The TrustRadius report gives the second reason to build references properly: 63 per cent of buyers used AI during their purchase journey, and 94 per cent of those fact-check the AI's responses at least some of the time. That fact-checking lands on your website - provided there is something verifiable there. Four consequences. First, every case study belongs on its own indexable URL, not in a carousel on the homepage. Second, numbers must sit in the text, not only in the graphic - a machine does not read JPG tiles. Third, the PDF behind the form is dead for visibility; put the short version openly on the page and keep the form for the detailed version if you need first-party data. Fourth, clean schema markup plus internal linking from the relevant service page stops the reference from becoming an orphan.
For completeness, the honest caveat: there is no defensible public figure for how often AI systems cite case studies, and anybody promising one is guessing. What is documented is that buyers verify AI answers and that they look for independent-looking proof during evaluation. That is reason enough to make your proof machine-readable and accessible without a hurdle.
The three levers
1. Results before prose. For your three most important clients, establish which number you can evidence with a time frame and a method. Only then write - otherwise you produce adjectives.
2. Write down the limits. One paragraph of "what did not go smoothly" per case study. It costs nothing and makes every other statement more credible.
3. One URL per reference. Its own page, numbers in the text, linked from the service page, no form gate on the short version.
If you like, we can walk through your existing references together: which number holds, which should be cut, and which client has the best story nobody has written down yet. 🙂